Allocation Model in vROps 7.5+

History Recap: In vRealize Operations 6.7 the capacity engine was re-engineered and the Allocation modelling capability was removed before being re-added in vRealize Operations 7.5. There’s no Allocation in vRops 6.7 to 7.0. You also need to enable Allocation in the policies in vROps 7.5, it’s not turned on out of the box (OOTB).

There are two primary classifications of reviewing capacity within vRealize Operations:

Demand – Capacity based upon the actual requested resource consumption (i.e. demand). Demand-based modelling is typically used by Managed Service Providers (MSP) as it represents the actual usage of the environment which has been licensed to other users. The more accurate the model. the more resources can be sold and the more money is made (let’s be honest it’s about the money!).

Allocation – The total consumption of a resource if it theoretically was used at 100% all the time. This is an older model that can be much simpler as it’s essentially just a subtraction from the total capacity. I typically find allocation in larger organisations where the IT infrastructure supports various different business organisations and cross-charging (or chargeback) is performed to help offset the IT costs. It’s also much easier to plan with as simply when it gets up to roughly ~75% allocated, you buy more hardware.

I’m going to talk about the Allocation model. As I see it, the allocation model has two primary use-cases, each with its own distinct event horizon (this is my terminology):

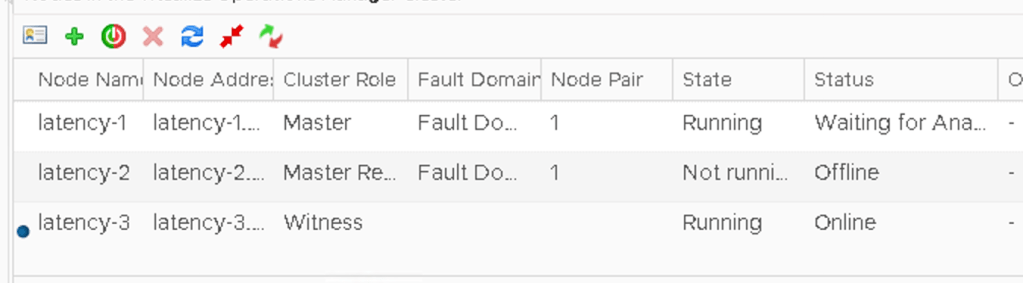
Short event horizon: I’m deploying new objects (VMs / Containers / whatever) right now or in the next few days. I need to know what the available capacity is right now. Therefore my usable capacity must exclude all resource providers (hosts, storage etc) that are not contributing (aka offline, in maintenance mode etc) to the capacity.

Long event horizon: I’m deploying new objects in a year. This is important when it takes a long time to purchase and prepare new hardware. Therefore my usable capacity should take the assumption that all of the resource providers are online and available. There’s probably no reason (I have one or two TBH, but that’s not the point here) for a resource provider to be offline / in maintenance mode for an extended period of time.

The Allocation model in vROps 6.6.1 was based upon the long event horizon. Hosts that where in maintenance mode were included in the usable capacity metrics.

The Allocation model in in vROps 7.5+ is based upon the short event horizon. Hosts that are in maintenance mode are not included in usable capacity.

vROps 8.1 Allocation Usable Capacity

Is this a problem?

It depends on the exact methodology used when trying to do long term planning. In large environments it’s a constant job to lifecycle manage the underlying infrastructure. There are almost always hosts in maintenance mode for patching and the inevitable hosts that are just going pop (at night, it’s always at night!).

It’s also worth remembering that the capacity planners (long-term) are not the same people that are often doing the deployments (short-term). There’s a whole raft of reasons the capacity planners might not even have access to vROps (operational, cultural, procedural), so the long term capacity planning might actually be done via data extract and not the UI. So that lovely ‘What-if’ functionality isn’t used (DevOps and SREs are typically code driven).

What does this affect?

This behaviour is seen in the following two metrics:

  • CPU|Allocation|Usable Capacity after HA and Buffer
  • Memory|Allocation|Usable Capacity after HA and Buffer

As far as I’m aware Disk Space|Allocation”Usable Capacity after HA and Buffer doesn’t have this behaviour (as you’d expected TBH).

I have this problem, what can I do about it?

In the most basic long term allocation modelling it’s fairly straight-forward to model using supermetrics.

For example, let’s talk about CPU.

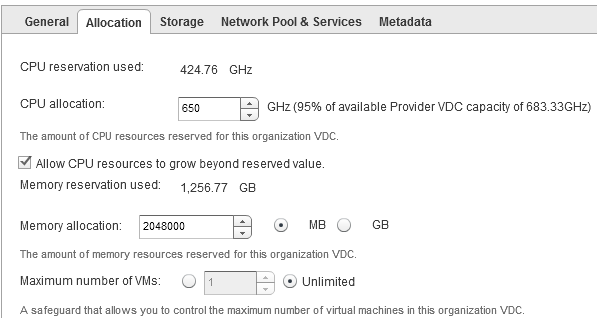
The allocation model, at the cluster level, models CPU capacity as vCPU. That is the total number of vCPU that can be deployed.

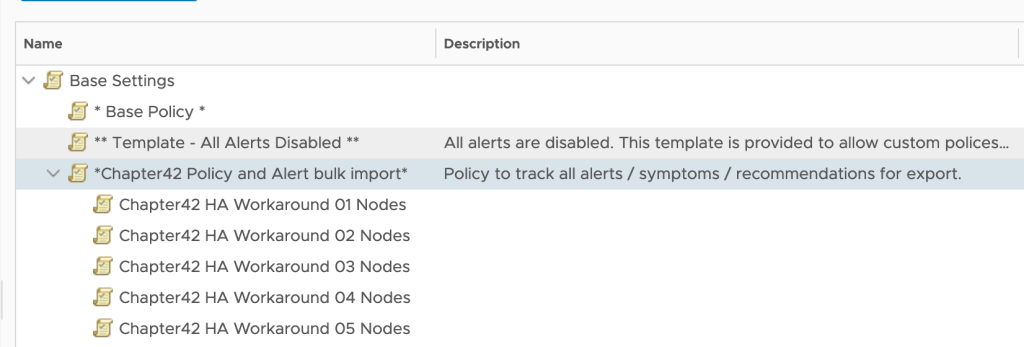
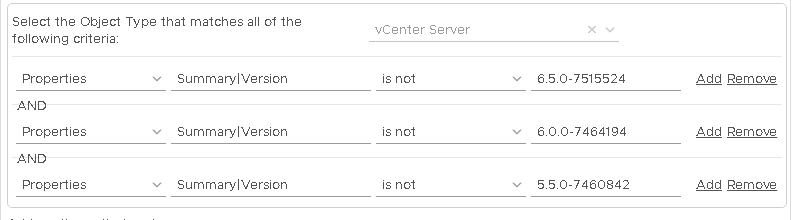
The standard OOTB metric for this is ‘CPU|Allocation|Usable Capacity after HA and Buffer‘ and it will show a usable capacity and this metric will vary depending on if hosts are in maintenance mode <See image above>.

Lets build a basic replacement that doesn’t care if hosts are in maintenance mode.

This calculation can be something fairly simple as:

((CPU|Number of physical CPUs (Cores) * ratio) * Cluster Configuration|DAS Configuration|Admission Control Policy|CPU Failover Resource Percent)) – (((CPU|Number of physical CPUs (Cores) * ratio) * Cluster Configuration|DAS Configuration|Admission Control Policy|CPU Failover Resource Percent)* buffer)) = Cluster Usable Capacity vCPU

Let’s use some numbers to see how this works. I’ve assumed the following (OOTB represents the vROps OOTB metric name if you need it):

  • Number of hosts in a cluster = 12
    • (OOTB: Summary|Total Number of Hosts)
  • Number of cores per host = 20
  • Number of physical CPUs in a cluster (or cores * hosts) = 240
    • (OOTB: CPU|Number of physical CPUs (Cores)) – this is variable though as it excludes hosts in MM.
  • Desired Ratio = 4:1
  • HA FTT = 1 Host
    • (OOTB: Cluster Configuration|DAS Configuration|Admission Control Policy|CPU Failover Resource Percent)
  • vROps additional Buffer = 5%

To the math:

(Total Hosts * Cores per host) = 240 physical cores (or OOTB: CPU|Number of physical CPUs (Cores))

240 * Ratio (4:1) = 960 vCPUs Total Capacity

(This could be a cool SM if you wanted to know the total number of vCPUs for a cluster, which vROps currently doesn’t tell you).

960 vCPU TC – OOTB: Cluster Configuration|DAS Configuration|Admission Control Policy|CPU Failover Resource Percent (8%) = 960 * 0.92 = 883.2 vCPU

883.2 * vROps buffer (5%) = 883.2 * 0.95 = 839.04 vCPU

Wrap the whole metric in the floor() function to get 839 vCPU as your usable HA content that will not change if hosts are in maintenance mode.

You can do something similar for Memory|Allocation|Usable Capacity after HA and Buffer as well, and that should be simpler.

NOTE: I’ve simplified the calculations above from the eventual supermetric customer delivered supermetric, and due to the hosting platform I currently can’t get formula’s to look nice so a few brackets might be misplaced.

How complicated can the supermetrics get?

Very very complicated depending on your particular requirements. Go beyond the very basics and it can include vROps SM if statements, which statements, arrays. Quite advanced supermetric stuff and if you really want to go to town, calculations scripted outside of vROps and then inserted into vROps.

If you’re really struggling I would recommend engaging with VMware about getting Professional Services involved.

Use Policies to migrate content between vROps instances

It’s been a minute since I last posted. So today I thought I’d just briefly outline how it’s possible to migrate some content between vRealize Operations deployments.

The content management cycle for vROps can leave a little to be desired. With policies, alerts, views, symptoms, recommendations metric configuration, supermetrics, reports and dashboards, there’s little inbuilt capability to quickly extract relevant objects and import to another vROps instance.

But you can use a policy to quickly migrate policy settings, supermetrics, alert definitions, symptoms and recommendations.

Here’s the basic process:

  • Build a new template
  • Enable locally in the policy all the supermetrics required
  • Enable locally in the policy all the alerts required
  • Export the policy as an .xml
  • Import the policy into the new vROps

That’s ok, but that’s for one policy. What about multiple policies?

Export them as before. Then open up the .xml and copy the <policy> branch to the import template file, adding the extra text ‘parentPolicy=”<ID of the master policy>”.

Nested vRealize Operations Export

In the image above I’ve exported five additional policies, and then added them to my import .xml file. Of key importance is how I’ve added the line parentPolicy=”eac91bc-4be7-487d-b1da-63dc6f5e25e8″ which matches the key of the top-level policy.

When this .xml is imported all the children are also imported.

Policy imported to new vROps

Then it’s possible to to just pick the new policy and apply the appropriate imported policy.

Build the new policy, ensuring that the policy will use the appropriate base policy.

Building a new local policy

Override the settings with the settings from the appropriate imported policy

Overriding the settings with the imported values

And voila, quickly and easily migrate policies, alerts and supermetrics between vROps instances.

A migrated policy ready to be used

vROps HA / CA clusters

Have you recently cast your beautiful eyes over the sizing guides for vRealize Operations 8.X? Of course you have; it’s mandatory reading. A real tribute to the works of H.G. Wells & H. P. Lovecraft.

Recently I was reviewing a vROps 8 design and the author had added a section on Continuous Availability (CA). The bit that caught my eye was a comparison table between CA and HA. Mostly specifically the maximum number of nodes. Something didn’t add up. Lets take a closer look:

vRealize Operations 8.0.1 HA Cluster Sizing
Figure 1. vRealize Operations HA Cluster Sizing
vRealize Operations 8.0.1 CA cluster sizing table.
Figure 2. vRealize Operations CA Cluster Sizing

Lets review the design guidance for a CA cluster:

Continuous Availability (CA) allows the cluster nodes to be stretched across two fault domains, with the ability to experience up to one fault domain failure and to recover without causing cluster downtime.  CA requires an equal number of nodes in each fault domain and a witness node, in a third site, to monitor split brain scenarios. 

Every CA fault domain must be balanced, therefore every CA cluster must have at least 2 fault domains.

So far that’s all fairly easy to follow but the numbers don’t align. An extra-large vROps HA cluster has a maximum number of nodes of 6 (the final column in Figure 1). The maximum number of nodes in a single fault domain is 4 (the final column in Figure 2). The minimum number of fault domains in a CA cluster is 2, therefore the total number of nodes in a CA cluster is 8.

Surely this is a mistake?

I asked the Borg collective for assimilation. They said no but did tell me, and I paraphrase:

The maximum number of nodes for vROps 8.X are different depending on if you are using HA or CA although the overall objects / metrics maximums are unchanged.

So, in conclusion, there is no increase in the objects or metrics that a CA cluster can support compared to a HA cluster. So the total supported* capacity remains the same, you can just have more nodes to support the CA fault domain capability.

*Obviously you can go bigger, but VMware support can tell you off.

*EDIT*

I’ve edited this post since it was originally posted to add some additional context and tidy up some of the language.

vROps and VCD – Speaking a common language

What’s this? Another blog entry. Clearly I’m not busy.

For the last few years I’ve been helping a few telcos (mobile phone providers for the layman) with their monitoring requirements for the various platforms (4G and 5G). At this point they’ve been using VMware’s NFV bundle, which consists of vSphere (or Openstack), vSAN, NSX, vROps, vRLI, VRNI (optional) and VCD. Whew that’s a lot of product acronyms and it includes VCD; aka VMware Cloud Director or vRA for people that need multi-tenancy.

WARNING, that’s a massive simplification of both products but hey I do monitoring, automation was a decade ago using scripts and powershell, I don’t need vRA or vRO to build VCF (/rasp).

But wasn’t VCD discontinued? Err, yeah but no. Dull story about business requirements and market opportunities, blah blah blah. Anyway, it’s still around and it’s good if you need it.

A few things about how VCD structures stuff. The underlying physical hardware is grouped into normal vSphere clusters. This is presented via VCD as a Provider VDC (VDC = Organisation Virtual DataCentre). The PVDC is then used to provide the resources to a group called the Organisation VDC. The OrgVDC is basically a resource pool, with reservations and limits, that a end customer, called a tenant, can then consume.

Clear.

Nope. It can be complicated and they use totally different names for vSphere constructs. I was going to make a picture to illustrate this, but I stole one a long time ago (apologies to whomever made this but it’s mine now. I licked it):

vCIoud Director Constructs
Not my image of VCD constructs.

To adequately monitoring this you need to connect vROps to VCD. There’s a management pack for this. You need to be very careful to get the correct management pack that supports the version of VCD. There are two components:

  • The management pack which connects to VCD
  • The tenant OVA, which is an appliance which is a static application that merges data from VCD and vROps into a few static dashboards for tenants (end-users).

I’m going to talk about the VCD MP.

Firstly; the VCD MP that is compatible with vROps 6.7 does not capture metadata from VCD. It’s also incomplete and uses (or used it might have finally been fixed) the VCD User API interface not the VCD Admin API so its missing various metrics (or it has bugs some may say). You can script around this and then inject the metrics into VCD. Kinda cool, but its custom and GSS fear the word ‘custom’.

vROps 7 and its associated VCD MP fixed a bunch of these issues. To collect the metadata enable ‘Advanced Metrics’ in the VCD MP configuration in vROps.

Now for the ‘fun’ stuff.

A OrgVDC in VCD can be Reservation or Pay-As-You-go and they have the ability to guarantee resources.

Guarantee.

Don’t recall seeing that in vSphere and vROps; because it’s not a term we use.

Lets look at a typical Reservation pool OrgVDC configuration:

An example of a VCD reservation pool OrgVDC
VCD reservation pool OrgVDC

There’s a few things we can see that are useful:

  • CPU Reservation Used
  • CPU Allocation from the PVDC
  • Memory Reservation Used
  • Memory Allocation
  • Maximum number of VMs

But they’re not named similar in vROps. Because that would be too easy. All vROps metrics are from the OrgVDC object.

VDC Label NameVDC ValuevROps MetricvROps Value
CPU Reservation Used424.76 GHzCPU|Used (MHz)424,760
CPU Allocation650 GhzCPU|Allocation (MHz)650,000
Memory Reservation Used1,256.77 GBMemory|Used (GB)1,256.7744
Memory Allocation2048000 MBMemory|Allocation (MB)2,048,000
Max number of VMsUnlimitedGeneral|Max Number of VMs0
VCD-2-vROps Reservation Pool

That’s not so hard. Nope, Reservation is fairly straight-forward. But Pay-As-You-Go (PAYG) is a different story.

PAYG can use quotas to allocation resources, and then allows a percentage of that quota to be guaranteed. To further up the ante it also allows for a different vCPU speed to be used against what’s actually in the physical server.

Lets get some numbers.

I have 1 cluster with 7 hosts, each host has 2 sockets and 18 cores per socket (36 logical processors). My socket speed is 3Ghz. This gives my cluster 756000 ((36 * 3000)*7) cycles total capacity. I can set the quota in VCD to unlimited (use all of it) or a set below it, but for simplicity I’ll set it to unlimited, so my single OrgVDC can use all 756Ghz (and don’t forget you can allocate multiple OrgVDC to a single PVDC. Do you hear contention?), but I’ll set a guarantee of 90%. On top of that I don’t want to tell VCD it’s using 3GHz processors, but 2.55Ghz processors.

Something like:

An example from VCD of a PAYG Pool OrgVDC
VCD PAYG Pool

As before there’s interesting and useful data here about how I INTEND my environment to be consumed:

  • CPU Allocation Used
  • CPU Quota
  • CPU Resources Guaranteed
  • vCPU Speed
  • Memory Allocation Used
  • Memory Quota
  • Memory Resources Guaranteed
  • Maximum number of VMs

To vROps we go:

VDC Label NameVDC ValuevROps MetricvROps Value
CPU Allocation Used688.50 GHzCPU|Used (GHz)688.5
CPU QuotaUnlimited<NOPE><NOPE>
CPU Resources Guaranteed90%<NOPE><NOPE>
vCPU Speed2.55 GHzCPU|vCPU Speed (GHz)2.55
Memory Allocation Used2,269.00 GBMemory|Used (GB)2,269
Memory QuotaUnlimited<NOPE><NOPE>
Mem Resources Guaranteed90%<NOPE><NOPE>
Max number of VMsUnlimitedGeneral|Max Number of VMs0
VCD-2-vROps Reservation Pool

Well that’s unexpected. How can you monitor your VDC PAYG models when vROps doesn’t have appropriate metrics?

Time for a cup of tea.

Defiantly not coffee.
Real people drink coffee

What is the quota?

The quota is the maximum amount of resources that can be consumed. An OrgVDC can never use more than the parent PVDC can provide. So any quota that is unlimited is essentially limited to the PVDC value.

If the OrgVDC has got a quota set (not unlimited), then CPU|Allocation and Memory|Allocation should be the vROps metrics (75% sure; my notes are unreadable on this).

Getting the parent PVDC to a OrgVDC is a supermetric. That’s not so difficult:

min(${adaptertype=vCloud, objecttype=PRO_VDC, metric=cpu|total, depth=-1})

The ‘depth=-1’ means go upwards, aka my parent. Apply to all OrgVDC’s and now you know how much capacity the parent has (for CPU in this example).

How to find Guarantee we need to understand how VCD relates to VMs:

pVDC -> orgVDC -> vApp -> VM

The similar vSphere relationship:

vCenter -> DataCentre -> Cluster -> Resource Pool -> vApp -> VM

But vROps is getting information from vSphere and where does vSphere set reservations and limits; on Resource Pools or individual VMs. VCD uses the limits and reservations on a VM.

Therefore you need two more supermetrics (or four: 2 for CPU and 2 for RAM);

  • One to create a reservation total for each vApp (based on the sum of all vApp child VMs), applied at a vAPP object.

sum(${adaptertype=VMWARE, objecttype=VirtualMachine, metric=config|cpuAllocation|reservation, depth=1})

  • One to sum the vApp SM for the OrgVDC, applied at an OrgVDC object.

sum(${adaptertype=vCloud, objecttype=VAPP, metric=Super Metric|sm_<ID of one above>, depth=1})

I tried to make a single supermetric but the system I was using wasn’t having any of it.

So now our OrgVDC object has the following supermetrics. This is a fleshed out model.

VDC Label NameVDC ValuevROps MetricvROps Value
CPU Allocation Used688.50 GHzCPU|Used (GHz)688.5
CPU QuotaUnlimitedSM – Parent CPU Total<756>
CPU Resources Guaranteed90%SM – Child VM CPU Reservations<See Below>
vCPU Speed2.55 GHzCPU|vCPU Speed (GHz)2.55
Memory Allocation Used2,269.00 GBMemory|Used (GB)2,269
Memory QuotaUnlimitedSM – Parent Mem Total<10,240>
Mem Resources Guaranteed90%SM – Child VM Mem Reservations<7.3>
Max number of VMsUnlimitedGeneral|Max Number of VMs0
VCD-2-vROps Reservation Pool with SuperMetrics

Ah, yeah, vCPU reservations on VMs. Do you remember way back I mentioned that you can use a different vCPU speed to the actual processor. Well, it’s time for that to make a guest appearance.

When VCD is setting the limit on the VM it’s taking that vCPU speed and mulitplying it via the number of vCPUs in the VM and using that value as the CPU limit.

2 vCPU machine on my 2.55Ghz vCPU speed VM is a limit of 4.6Ghz. BUT when a VM is started up the CPU speed is determined by the actual processor speed in the physical host, in my example earlier 3Ghz, so the total capacity of the VM vCPU is actually 2 vCPU * 3Ghz = 6GHz total capacity, so the VM has:

Total Capacity as determined by vSphere6Ghz
Total Capacity as intended by VCD4.6Ghz
Limit as set by VCD at 100% and enforced by vSphere4.6Ghz
Reservation as set by VCD at 90% and enforced by vSphere4.14Ghz
VCD Intention vs vSphere Reality

Notice that the Limit and the Total Capacity are very different. That will appear as Contention in vROps if the VM is under load. Better make sure your capacity planning processes are up to speed.

One thing to be conscious of is the values that are being used. VCD works in MB and GB, Mhz and GHz. vROps typically works in MB and MHz. There’s no way to resize the units with supermetrics (EDIT: vROps 8.1 can adjust units in SuperMetrics but as of this blog post I’ve not tested it).

So why do all this?

Monitoring. Performance and Capacity. At the most basic level it’s very hard to determine the Total Capacity vs Allocated vs Demand vs Reservation vs Guarantee across VCD OrgVDCs. The metrics don’t line up. VCD is about intentions but the enforcement is done by vSphere and as the vCPU Speed example shows, Intention and Reality don’t always work seamlessly and you need that operational intelligence to understand whats actually going on; what are the VMs that deliver your services to your customers actually doing.

So all that said, what did this eventually lead to?

With some VMware PSO magic, a trend line on a graph.

vRealize Operations Continuous Availability

As Grandfather Nurgle blesses Terra with his latest gift I decided to have a little play with vRealize Operations 8.0 and Continuous Availability (CA).

CA (for I’m not writing continuous availability all the time) is the enhancement for vROps HA that introduces fault domains. Basically HA across two zones with a witness on a third location to provide quorum.

I’m not going into the detail about setting CA up (slide a box, add a data node and a witness node). Lets look at three things that I’ve been asked about CA.

Question 1; Can I perform a rolling upgrade between the two fault domains ensuring that my vROps installation is always monitoring?

No. The upgrade procedure appears to be the same, both FDs need to be online and accessible and they both get restarted during the upgrade. There’s no monitoring.

I hope that in a coming version this functionality appears (and I’ve no insight, no roadmap visibility) because we’ve asked a few times over the years.

Question 2; How does it work in reality?

Aha. Finally, take that marketing. A free thinking drone from sector sieben-gruben.

Lets build it and find out. So I did.

The environment is a very small deployment:

2 Clusters, consisting of a VC 6.7, a single host (ESXi 6.7)

  • vROps 8.0 was deployed using a Very Small deployment to the two clusters, a node in each.
  • The witness node was deployed externally as a workstation VM.
  • The entire thing is running in under 45GB of RAM and on a SATA disk (yeah SATA!)
  • CA was then enabled and upgraded to 8.0.1 Hotfix (which answered Q1).

Which looks like this:

The node called Latency-2 (dull story, just go with it!) is the master node, so lets rip the shoes of that bad boy and watch what happens…

Straight away the admin console started to spin it’s wheels

Then it came back and the Master node is now Inaccessible with the CA ‘Enabled, degraded’

It’s 2.50mins and the UI as a normal user is usable, slow, with a few warnings occasionally, but usable. The Analytics service is restarting on the Replica node.

An admin screen refresh later and the Replica is now the Master and the analytical service is restarted. The UI is running. Total time, 5.34min.

Not too shabby.

Note that the FD2 is showing as online but the single member node is offline.

I wonder if the ‘offline’ node knows it’s been demoted to Replica?

A quick check of the db.script reveals that it’s actually offline with a ‘split_brain’ message and it appears to be ready to rejoin with a role of ‘Null;.

Lets put it’s shoes back on and see what happens:

The missing node is back and as the replica, albeit offline. The UI isn’t usable and is giving platform services errors.

At this point I broke it completely and I had to force the cluster offline and bring it back online. However, I’ve done this CA failover operation a few times and it’s worked absolutely fine so whilst I’m pleased it broke this time, for me it highlights how fragile CA is.

Anyway, it didn’t come back online. It was stuck waiting on analytics. Usually this means a GSS call.

What’s my exposure to Meltdown and Spectre

**UPDATE**

VMware have released a vRealize Operations pack, which you can read about and download from here.

It’s entirely possible that this pack features an updated version of this dashboard 😉

****

Saunter in the office, after the New Year break, ready for the challenges that 2018 will bring. The coffee is barely out of the pot when Intel drops a late crimbo present…

It’s in the mainstream media and the directors are panicking “What’s my exposure?”

Well let’s ask vRealize Operations.

So this blog post will concentrate on my VMware lab, and images are obviously edited to remove details, but the principles work.

There are four areas that are immediately exposed to me via vRealize Operations that I can use to see where I’m carrying a risk:

  • Physical Server BIOS
  • VMware vCenter
  • VMware ESXi
  • VMware VM hardware level

I want a pie-chart for a quick visualisation and ideally a list of objects that need patching.

Create a new dashboard:

meltdown.1-new

Then I shall use the View widget (enabling information to be presented in both a pie-chart and a list) and layout my dashboard:

meltdown.2-layout

To create the first view, edit the widget providing:

  • Title
  • Self-Provider : On
  • Object : vSphere Hosts and Clusters, vSphere World

meltdown.4-biospie

Create a view with the following settings:

  • Name = Some easily identifiable unique name
  • Description = Something relevant
  • Presentation = Distribution
  • Visualisation = Pie Chart
  • Subject = Host System
  • Data = Host System, Properties

Add the following properties:

  • Hardware | Hardware Model

Provide a better metric label and optionally add a filter. I’ve not because my BIOS levels are for HPE and just show the BIOS family, so not entirely useful.

Hit Save and then Save again to load the view to the widget and voila, physical host BIOS versions.

Move to the next widget to the right and lets create a similar view that shows a list of the physical hosts. Edit the widget and provide:

  • A Title
  • Self-Provider : On
  • Object : vSphere Hosts and Clusters, vSphere World

Create a view with the following settings:

  • Name = Some easily identifiable unique name
  • Description = Something relevant
  • Presentation = List
  • Subject = Host System
  • Data = Host System, Properties

Add the following properties:

  • Hardware | Hardware Model
  • Hardware | BIOS Version
  • Runtime | Power State

Hit Save and then Save again to load the view to the widget and voila a list of the  physical host models, BIOS versions and power state.

meltdown.6-biosx2

Ahh, vROps, fifty shades of blue. Horrendous.

Anyway moving onwards, similar process again for vCenter Build numbers, ESXI Build numbers and VMware hardware level.

Something similar to:

meltdown.3-finallayout

Lets get a little more advanced: lets filter out my vCenters that are already patched to the appropriate level.

Lets jump over to VMware’s vCenter download page for vSphere 6.5, vSphere 6.0 and vSphere 5.5 and get the new patched build numbers.

Click on More Info to see the build number (6.5 shown)

meltdown.11-buildv

Back in vRealize Operations, edit the first vCenter widget and edit the view.

In the main Data view, switch to the Filter tab

Check the preview source to see that the Summary|Version property is the full version number, and that the final part is the build number

meltdown.7-vc

At the bottom of the screen add the following filter criteria:

  • Properties Summary|Version is not 6.5.0-7515524
  • Properties Summary|Version is not 6.0.0-7464194
  • Properties Summary|Version is not 5.5.0-7460842

meltdown.8-vcfilter

Save this amendment and now only the vCenters that are not at the appropriate patched levels will show.

NOTE: This will also also show vCenters that are above the filtered level

Repeat this process for the vCenter remediation list view widget:

meltdown.9-vcx2

Repeat until your sick of blue:

meltdown.10-db1meltdown.10-db2

** Download removed, because a newer version is included in the VMware pak, outlined above.


vRealize Operations to Splunk

vRealize Operations is a fantastic data analysis tool from VMware, but its ability to talk to other products has always been limited to a few options.

Recently I needed to make vROps forward on its alerts to the log analysis tool Splunk using a Splunk HTTP Event Collector (HEC). This means taking the REST output from vROps and forwarding it on to the HEC;

Blog - vrops2splunk-WebShim

VMware call this a Web-Shim and the basic process is outlined in VMware’s John Dias excellent blog series. That blog series discusses using vRealize Orchestrator, so it was time to get learning Python.

I broke this into 4 stages:

  1. Generate a vROps output
  2. Capture the vROps output in a webshim
  3. Generate a Splunk input
  4. Use python to turn the vROps output into the Splunk input

I didn’t figure this out in this order, it’s just easier to read it in this order!

Stage 1 – Generate a vROps output

Lets start at the beginning. We want to send an alert to Splunk via the HEC. I could wait around for vROps to send some alerts, or I can build one I can trigger as required.

I like to have an alert that monitors the VMware tools service. I then stop and start the VMware Tools service as required which triggers an alert:

Blog - vrops2splunk-vropsalert

And now it’s time to configure vROps to send the alert notification. From inside vROps you will need to configure an outbound server:

vrops-shim-outbound

This is a fairly basic configuration, just ensure that the URL points to the name of the function in the Python code.

Configure a notification event. I used a notification that will send everything to Splunk:

vrops-shim-notification

Finally I have an EPOps alert that I can trigger on demand. I have added a simple recommendation to this alert:

vrops-shim-custom-alert

Now to generate this alert on demand, I go to my test box (vSphere Replication with VMware Tools and EndPoint Operations), start vRealize Operations EPOps agent, and then stop the VMware Tools service. This will trigger the alert, which will appear in my shim. Then just restart VMware Tools to cancel the alert.

This can be used multiple times to test the code:

vrops-flipping-tools

Stage 2 – Capture the vROps Output in a webshim

Having originally followed and copied John’s web series I already had a PhotonOS environment that could host the webshim code. Digging deeper in this example code I discovered that it was possible to reuse pieces of VMware’s code to capture and parse the vROps output.

NOTE: I did discover this after almost pretty much writing something vaguely similar and functional but VMware’s code was just better!

From the VMware code I took the basic folder layout and modified the following file:

  • __init__.py

This file has the various logic for parsing both LogInsight and vRealize Operations input, along with the sample webshims. I modified this file at the bottom where it imports the various webshim Python code:

# Import individual shims
#import loginsightwebhookdemo.bugzilla
#import loginsightwebhookdemo.hipchat
#import loginsightwebhookdemo.jenkins
#import loginsightwebhookdemo.jira
#import loginsightwebhookdemo.kafkatopic
#import loginsightwebhookdemo.opsgenie
#import loginsightwebhookdemo.pagerduty
#import loginsightwebhookdemo.pushbullet
#import loginsightwebhookdemo.servicenow
#import loginsightwebhookdemo.slack
#import loginsightwebhookdemo.socialcast
#import loginsightwebhookdemo.template
#import loginsightwebhookdemo.vrealizeorchestrator
#import loginsightwebhookdemo.zendesk

# Shim for Splunk...
import loginsightwebhookdemo.splunk

I commented out the other webshims and added the splunk webshim code.

Then I created the file splunk.py and placed it into the loginsightwebhookdemo folder:

file-layout

It’s time to start writing some Python code.

To enable use of the functions included in the __init__.py file, I added the following lines to the top of the splunk.py.

#!/usr/bin/env python
from loginsightwebhookdemo import app, parse
from flask import request

I then created the Splunk webshim entry point into the function:

@app.route("/endpoint/splunk", methods=['POST'])
@app.route("/endpoint/splunk/<ALERTID>", methods=['POST','PUT'])
def splunk(ALERTID=None):

Finally I call the parse function from __init__.py to take the incoming payload (request) and produce a Python dictionary (alert):

 alert = parse(request)

If you look at this parse function in __init__.py you can see that it outputs to the screen the information that it is passed:

logging.info("Parsed=%s" % alert)

Finally close the Python function block:

 return

This completes the necessary code basic Python code:

#!/usr/bin/env python

# These are integration functions written by VMware
from loginsightwebhookdemo import app, parse
from flash import request

# This is the splunk integration function
@app.route("/endpoint/splunk", methods=['POST'])
@app.route("/endpoint/splunk/<ALERTID>", methods=['POST','PUT'])
def splunk(ALERTID=None):
 # Retrieve fields in notification, using pre-written VMware function
 alert = parse(request)
 return

With everything now configured, I start the Flask webserver using:

python runserver.py 5001

Once that’s running trigger the alert. The splunk code will be called with the vROps payload output to the screen:

vrops-parsed

Stage 3 – Generating a Splunk input

Splunk helpfully outline how to generate entries from the command line for the HEC:

curl -k -u "x:<token>" https://<host>:8088/services/collector -d '{"sourcetype": "mysourcetype", "event":"Hello, World!"}'

Let’s take a look at what this needs

  • -u “x:<token>”

This refers to the authorisation token, which needs to be created from Splunk

This refers to the HEC URL. Simply replace <host> with the FQDN of your HEC server.

  • -d ‘{“sourcetype”:”mysourcetype”,”event”:”hello world”}’

Putting this together will generate the ubiquitous Hello World message in Splunk:

Blog - vrops2splunk-cli

Excellent, now we need to programatically do the same.

What you don’t want to do is lots of trial and error, work out its the requests function within Python and then write a cheap, quick and dirty version of the callapi function in __init__.py. What you want to do is just use the callapi function in __init__.py that VMware provide. This has the following definition:

def callapi(url, method='post', payload=None, headers=None, auth=None, check=True)

Using my previous trial and (mostly) error I know what is needed:

  • url

The URL of the Splunk HEC, https://<host&gt;:8088/services/collector

  • method

We want to POST the message to the Splunk HEC

  • payload

The message “hello world

  • headers

The Splunk token that is used for authentication, “x:<token>”

  • auth

The Splunk authentication token is passed as a header, so this will be NONE

  • check

This relates to SSL certificate checking, which I want to ignore initially, so this will be FALSE

To write this into the Python splunk.py file.

Adjust the import lines to include the callapi and json functions:

from loginsightwebhookdemo import app, parse, callapi
from flask import request, json

To provide some portability to the code use constants to hold the values for the Splunk HEC URL and Token:

# This is the Splunk HEC URL
SPLUNKHECURL = "https://<FQDN>:8088/services/collector/event"

# This is the token to allow authentication into Splunk HEC
# Keep this secret, as anyone with it can inject information into Splunk
SPLUNKHECTOKEN = "Splunk 1234X12X-123X-XXXX-XXXX-12XX3XXX1234"

Inside the splunk function we need to build the necessary header and body of the call to the Splunk HEC.

Add a header variable that holds the HEC authorisation token:

MESSAGEHEADER = {'Authorization': SPLUNKHECTOKEN}

Create the body of the Splunk message:

MESSAGEDATA = {
 "sourcetype": "txt",
 "event": { "hello world" },
 }

Finally add the callapi call to the return line so the function will close out this function by outputting any return value from using the callapi function:

# Post the message to Splunk and exit the script
return callapi(SPLUNKHECURL, 'post', json.dumps(MESSAGEDATA), MESSAGEHEADER, None, False)

The body of the splunk.py file now looks like:

#!/usr/bin/env python

# These are integration functions written by VMware
from loginsightwebhookdemo import app, parse, callapi
from flask import request, json

# This is the Splunk HEC URL
SPLUNKHECURL = "https://<FQDN>:8088/services/collector/event"

# This is the token to allow authentication into Splunk HEC
# Keep this secret, as anyone with it can inject information into Splunk
SPLUNKHECTOKEN = "Splunk 1234X12X-123X-XXXX-XXXX-12XX3XXX1234"

# This is the splunk integration function
@app.route("/endpoint/splunk", methods=['POST'])
@app.route("/endpoint/splunk/<ALERTID>", methods=['POST','PUT'])
def splunk(ALERTID=None):
 # Retrieve fields in notification, using pre-written VMware function
 alert = parse(request)
 
 MESSAGEHEADER = {'Authorization': SPLUNKHECTOKEN}
 MESSAGEDATA = {
 "sourcetype": "txt",
 "event": { "hello world" },
 }
 
 # Post the message to Splunk and exit the script
 return callapi(SPLUNKHECURL, 'post', json.dumps(MESSAGEDATA), MESSAGEHEADER, None, False)

Now when vROps sends the notification it will be parsed and displayed to the screen and a Hello World output will appear in the Splunk HEC.

Stage 4 – Use python to turn the vROps output into the Splunk input

Nearly there!

All the necessary code is actually done, the only section that now needs updating is the actual MESSAGEDATA and this is where the actual requirements are fulfilled.

It’s fairly simple. The parsed output is a Python dictionary which is called alert. The values within alert are referenced by their element and output the value:

value = alert['element']

How do you know what elements are included? They’re actually shown in the parsed output from the parse function:

vrops-parsed

For example:

value = alert['status']

Will give an output of ‘ACTIVE’

vrops-element-example

In this example I will pull in a few elements that are included in the parsed alert output:

MESSAGEDATA = {
 "sourcetype":alert['resourceName'],
 "event":{
   "Title": alert['AlertName'],
   "Impacted_Object": alert['resourceName'],
   "Source": alert['hookName'],
   "Status": alert['status'],
 },
}

And in a nutshell, that’s how to get vROps sending basic alerts to Splunk via a HEC.

But wait… the alert notifications doesn’t contain half the information that we need. We need to call back to vROps to get the rest of the information.

Stage 5 – Phoning home for more information

At this point, it’s going to basically be REST API calls back to vROps and this is fairly well documented at https://<VROPS FQDN>/suite-api/docs/rest/index.html

To make this work above the body of the Splunk function add some additional constants that will hold various authentication code and URLs.

# vRealize Operations Details
VROPSURL = "https://<FQDN>"
VROPSUSER = "admin"
VROPSPASSWORD = "password"
VROPSAPI = "/suite-api/api"
VROPSAPIALERT = "/suite-api/api/alerts"

Now in the body of the function, before the MESSAGEBODY variable is built, add some lines to build the URL of the alert and make a REST call back to vROps:

The vROps output needs to be in JSON format:

jsonHeader = {'accept': 'application/json'}

And build the correct URL for calling the alert:

ALERTURL = VROPSURL + VROPSAPIALERT + "/" + ALERTID

Now make a request to the URL passing the various authentication parameters and storing the output:

 alertIDResponse = requests.get(ALERTURL , headers=jsonHeader, auth=(VROPSUSER, VROPSPASSWORD), verify=False)

Check the response code and collect the alert Definition ID number:

if alertIDResponse.status_code == requests.codes.ok:
  alertDefID = alertIDResponse.json().get('alertDefinitionId')
else:
  alertDefID = "Unable to find the alert"

Now alertDefID variable holds the definition ID and from this we can make another REST call and get the alert definition information. This will include a recommendation ID number (if the alert has any recommendations). Then you can make another REST call to vROps using the Recommendation alert ID and get the recommendation information.

Put all of this together and you can send Splunk the Alert, the definition and any recommendation.