vRealize Log Insight Webshims

Now don’t worry, I’m not about to start blogging every week, I’ve just got some free time at the moment.

Earlier in the summer I was asked how difficult would it be to take a unknown stream of data and make some Log Insight events from that data and how long would it take. That’s pretty hard to quantity given the ‘unknown stream’, but sending data into Log Insight isn’t particularly difficult via the REST API, if you know what you’re doing. The conversation went quiet until much later when I was asked again. This typically means someones doing something interesting but again there was no information about the incoming data stream (and it’s probably an odd use-case to send non logs to a syslog server), but it intrigued me. This is also a great opportunity to revisit my blog on webshims because any solution will involve a box sitting in the middle taking the incoming stream and formatting it into a REST API call to vRealize Log Insight.

Drafting a solution

Because I’ve no idea of the incoming data stream I started in the middle: standing up a webshim and then making a module that sends information into vRealize Log Insight.

Grabbing my old notes, I opened up a Linux server and grabbed the webhooks code from the VMware GitHub repository using the ‘manual’ steps with an additional step. To be clear, this is to quickly build a Flask webserver that I can use as a starting point. The steps used are:

  1. virtualenv loginsightwebhookdemo
  2. cd loginsightwebhookdemo
  3. source bin/activate
  4. git clone https://github.com/vmw-loginsight/webhook-shims.git
  5. cd webhook-shims/
  6. pip install -r requirements.txt
  7. pip install markdown

At this point I can run the standard VMware webserver

python3 run-server.py 5001

Writing the vRealize Log Insight Event Shim

Before I get into this, lets all remember that I’m not a programmer and I don’t know Python particularly well either. I’m sure there’s better ways to do this, or I’m breaking some rule somewhere.

The first job is to create a source file for the vRealize Log Insight shim, starting with various functions and libraries that will be need:

from loginsightwebhookdemo import app, callapi
from flash import json
import time
from datetime import datetime

From the original __init__.py file I want to use app and callapi, otherwise the rest of the file isn’t required for this. Log Insight is expecting JSON formatted events with the appropriate time, specified in epoch time.

Next I tend to have the Variables and Constants. This is where I place all the hard coded bits and bobs or adjustable code so I can manipulate the script without re-writing stuff.

# Variables
VRLI_URL = "https://<FQDN_VRLI>"
VRLI_API_EVENTS_UUID = "111-MY-TEST-VM"
# Constants
VRLI_API_URL = ":9543/api/v1"
VRLI_API_EVENTS_URL = "/events/ingest/"
VRLI_HEADER = {"Content-Type": "application/json"}

This is fairly explanatory apart from the ‘UUID’. When sending an event via the REST API to Log Insight the URL must end in a UUID. This UUID must be unique, but it appears to be free text. I make the UUID up and the messages arrive. In any environment this will probably need to change, so I have a variable and give it a random string. This is not the ‘source’ magic field, in fact, I’ve not seen where this UUID is surfaced in the Log Insight UI.

Now it’s time to define the main core of the webshim. This will be the entry point and it will accept a block of text and format it for ingestion by Log Insight.

@app.route("/vrli_event/<EVENT_INPUT>", methods=['POST'])
def vrli_event(EVENT_INPUT=None):
  eventDetails = {}
  buildCustomDict(eventDetails, EVENT_INPUT)
  VRLI_FULL_URL = buildVRLIURL()
  MESSAGEDATA = {
      "events":[{
        "text": eventDetails['eventMessage'],
        "timestamp": eventDetails['eventTime']
      }]
  }
  return callapi(VRLI_FULL_URL, 'post', json.dumps(MESSAGEDATA), VRLI_HEADER, None, False)

The function is called with a passed block of text, which I reference with <EVENT_INPUT>. I then create a python list ( eventDetails = {} ) which I will use to store the data that I want to send to Log Insight. The next line ( buildCustomDict() ) is passed the newly created list object and the message block. The list is then updated with the text block, and the epoch time. We will look at this function shortly.

NOTE: I chose to do it this way to make it easier to adjust the code in the future. On longer code, I often track a number of internal variables with a list which enables me to keep things organised before I output to a log file.

I then build the full REST API URL ( VRLI_FULL_URL = buildVRLIURL() ) before building the correct JSON structure for the message block. Then I use the callapi function to post the event to Log Insight.

Fairly straight forward.

I then need to flesh out two additional functions:

  1. buildCustomDict()
  2. buildVRLIURL()

buildCustomDict(responseDict, dictInput=”ERROR – No Event Passed”)

Builds the structure of the passed list, known as responseDict and records the passed message block, with an error message if nothing is passed.

  humantime = datetime.today()
  epoch, spare = (str(time.mktime(humantime.timetuple()))).split(".")
  responseDict.update({
    "eventMessage": dictInput,
    "eventTime": epoch,
  })
  return

The line ( epoch, spare = (str(time.mktime(humantime.timetuple()))).split(“.”) ) takes the current date (held in the humantime variable) and converts it to an epoch time, which seems to be in the format XXXXXXX.0. This doesn’t actually work with Log Insight, so I convert it to a string and then split the string. The variable spare is the trailing 0 and is ignored.

NOTE: It appears that just sending a message into Log Insight via API without a epoch time specified will allow Log Insight to just assign the current time when the event was processed.

buildVRLIURL()

This is a simple function that builds the complete URL that I will post to. This could be done within the main function but I typically split these out in case I refactor the code later on. In this instance I might want to rejig this based on UUIDs, so to avoid re-coding the main function I can just fiddle with this function.

output_URL = VRLI_URL + VRLI_API_URL + VRLI_API_EVENTS_URL + VRLI_API_EVENTS_UUID
  return output_URL

And that’s the bulk of the code, minus lots of logging code. Nothing too difficult.

Testing the code

I also wrote an additional very small function that takes a block of text and converts each sentence into a log message.

TEXT_EXTRACT="Blah. Blah. Blah."

@app.route("/read_format_text")
def read_format_text():
  LINES = TEXT_EXTRACT.split(".")
  LINES_COUNT = len(LINES)

  for LINES_COUNT in LINES:
    vrli_event(LINES_COUNT)

  return

For space here I’ve swapped out the text for ‘Blah. Blah. Blah.

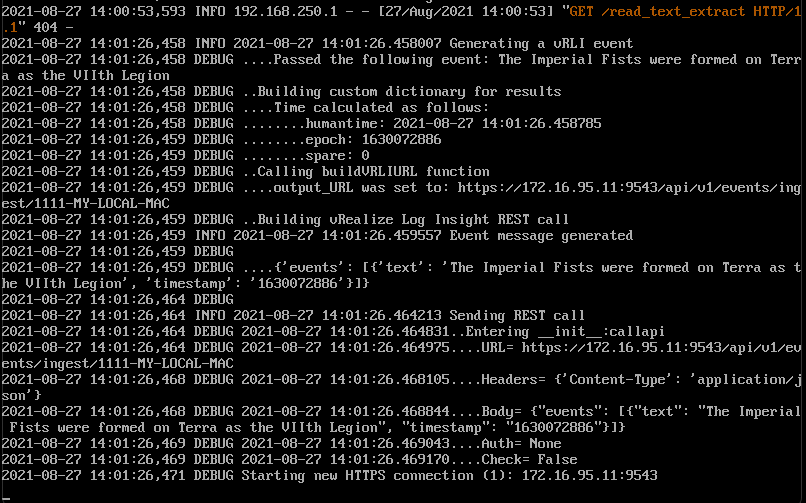
To call the test function:

Calling the Test function for the Log Insight webshim.
And the Blah Blah Blah text as it appears in Log Insight.

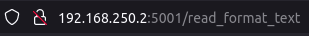
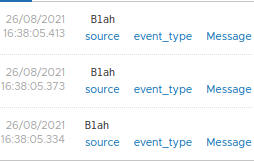
oooh, look at that. It works, albeit I’ve not bothered to code a trim in to prune the errant spaces.

Ok, well that’s an horrific insight into my code but how would I expect this to actually be deployed? Well, actually, in keeping with modern’ish IT, a container. So lets stick all this into a container and run it via Docker.

Building a Docker container

I could just hatchet the VMware Docker image, but it’s 3 years old and running Photon 1. I want to use the latest Photon (Photon 4), so lets build an fresh docker image.

In my collection of VMs I already had a Photon 4 OS lying around (you mean you don’t??) so I grabbed it and turned Docker on and set it to start automatically (it’s off by default):

systemctl start docker
systemctl enable docker
docker info
Running 'docker info' provided some information about the docker install in the VM.

To create a docker image you need to build up the various layers, starting with the basic image. In my docker file I added the following lines:

FROM photon
RUN yum -y update
RUN tdnf install python3 python3-pip -y
RUN python3 -m pip install Flask requests markdown
RUN mkdir vrli_webshim
COPY vrli_webshim /vrli_webshim
COPY vrli_webshim/webshims /vrli_webshim/webshims

I’m basically grabbing the latest Photon image and updating it. Then I install Python and PIP, using the newly installed PIP to install some Python modules and then make the folder structure I need. The two copy commands copy my code into the docker image file. I had to specifically copy the child folder structure.

Once that file was completed and I had my code placed into the same folder it was time to build the Docker image:

docker build -t  vrli-webshim:0.1 .

Then I ran the image:

docker run --network host -it vrli-webshim:0.1

I used –-network host because this is on a nested VM and this was the quickest way to get access to the web front end. Because I ran this as an interactive session ( -it ) I can manually run the webshim:

python3 /vrli_webshim/runserver.py 5001
It works and it shows that a request hit the intro webpage.

It’s alive!!

And if I trigger the test function:

The test function is triggered and the text is reformatted and sent on to Log Insight.

Good golly gosh. and bonus Games Workshop lore as well. You lucky people. Time for a coffee.

…one minute week later…

That was a long coffee. Where was I? Oh yes. Lets get the docker container starting automatically upon the server boot.

To do this we need to amend the DockerFile to run the following command. This is added to the very end of the DockerFile.

CMD ["python3", "/vrli_webshim/runserver.py", "5001"]

The CMD call takes an array of parameters consisting of the primary call, followed by a number of arguments. Rebuilding the image (as a new interation) and testing shows that the container now automatically starts the Flask server.

docker build -t  vrli-webshim:0.2 .
docker run --network host -it vrli-webshim:0.2
The container now automatically runs the Flask webserver upon startup.

Time to configure the Photon machine to start this new container on reboot and then we have a self-contained image. This appears to be a fairly straightforward additional argument on the docker start upline:

docker run --restart always --network host -it vrli-webshim:0.2

A few test reboots and it appears that the webshim is starting automatically.

Testing the container, reboot 1
Testing the container, reboot 5

Time to export this new image:

docker save vrli-webshim:0.2 > vrli-webshim.tar

And via the magic of SFTP I’ve copied it to a new Linux machine, based on Mint.

A fairly Minty fresh VM.

Lets import that image see if this works.

docker load < vrli-webshim.tar
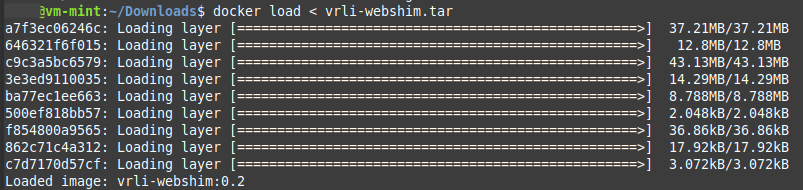
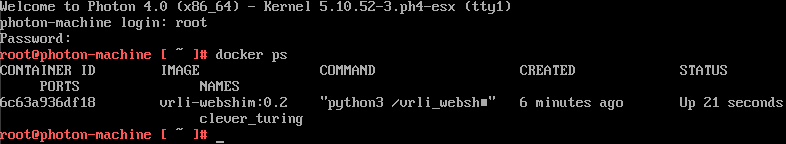
Docker image loaded up successfully.

And does it run?

docker run --network host -it vrli-webshim:0.2
It's running on the new Linux box.

Yes it does. To make it run upon startup I would need to add the –restart argument as obviously this is a docker instance specific argument.

And does the test function work…

A working portable web-shim to import messages into Log Insight.

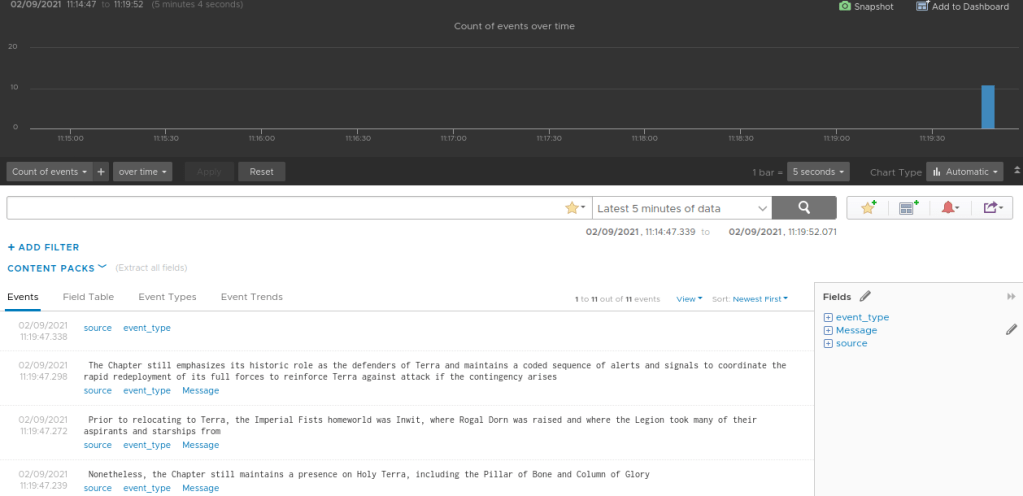
Excellent. To recap, I’ve built a portable containerised webshim, using a new Photon4 base image that will take an array of strings and send that array as messages to Log Insight. The other side would be an additional webshim that captures the random text and does some formatting based upon the exact nature of the incoming data stream.

Might be time for a biscuit.

NSX-T, vRealize Log Insight and vRealize Operations

Nine months. It’s been nine months since the last post. What have I been doing? Well, lots of things:

  • Got a published whitepaper (which I can’t blog about because it’s paid content)
  • Recorded a change management video (which I can’t blog about because it’s paid content)
  • Conducted basic and advanced training (which I can’t blog about because it’s paid content)
  • Handled various escalations (which I can’t blog about because…seriously you’re asking…)

Then the batphone rang. Someone has identified that there are a series of alerts from NSX-T which are present in NSX-T manager but are not appearing in vRealize Operations, and therefore this is causing them operational problems within their ITSM.

Now this looks like a job for me
So everybody, just follow me
'Cause we need a little controversy
'Cause it feels so empty without me

Eminem – Without Me

With nary a nod to self-preservation I jumped straight in and gathered the available tools, vROps 8.1, vRLI 8.1 and NSX-T 3.0.

  • Job 1: Can we see the alerts in NSX-T (yes we can)
  • Job 3: Can vRLI see the alerts via the log events (yes it can)
  • Job 3: Can we see the alerts in vROps (nope)

Success. As long as vRLI can see the events in the log files then we can raise an alert to vROps.

Excellent, I’m 10 minutes in and I’ve already solved this problem. Ah, nope. vRLI will raise the alert to vROps and it will correctly assign it to the vROps element. This doesn’t account for physical devices (physical edge nodes), actual NSX-T services (vROps has the concept of Edge Node or management node), and this all could be inconsistent which then breaks the customers ITSM.

It was at this time, I realized we have an interesting problem to solve; It’s not about getting the info or seeing the alert, it’s about making a consistent process that an unrelated 3rd party product can handle, without being overly complex.

Lets dig into the three components I can influence and see what we need from each of them.

NSX-T

This one is fairly straight forward. We need to ensure that the log files from NSX-T are being sent to Log Insight. If you’re still using NSX-V(sphere) and using scripts then NSX-T is much easier.

Log into NSX-T Manager | System | Fabric | Profiles | Node Profiles

Screenshot of NSX-T Manager showing global node profiles for syslogging.

Now you just have to choose to use either syslog or the inbuilt Log Insight agent. Beyond some additional agent based magic fields there’s not much between the two options. I figured all this out using syslog but personally I would look to use Log Insight agents if I had the choice. Not because it offers better logs but it offers more possibility for future expansion and options.

The log level I selected was Information, because some of the alerts that the customer wanted are classified as Information, rather than warning or above. Again this can be to your own requirements but generally it’s Information by default IME.

After this I jabbed an NSX-T expert to generate some messages so I had some test messages to begin working on.

vRealize Log Insight

Events are being sent into Log Insight so next up was to make sure that I’m detecting the right events. There are quite a few ways I could configure this but I chose to make this very straight-forward for the customer; I created a simple query based upon multiple text filters.

For example, the alert ‘Edge CPU Usage Very High’, configured to trigger for testing:

vRealize Log Insight showing 'Edge CPU Usage Very High' event.

I chose to make a number of text filters as it’s very easy to understand and maintain:

Simple vRealize Log Insight query filtering for NSX-T alert 'Edge CPU Usage Very High'

This query can then be saved. At this point you might be thinking how did I know the actual message NSX-T would send and the simple answer is it’s documented here by VMware, although it’s not 100% accurate.

The next step is to determine how vRLI will send the alert onto vROps. This is two parts. The first is to ensure that vRLI is linked to vROPS. If you’ve got both vROps and vRLI you should have them linked and I’m not going to show how to do this but at a minimum ‘Enable Alert Integration’.

vRealize Log Insight to vRealize Operations integration

So far this has all been fairly basic stuff. Setup logging and a few queries. Now we come to the first tricky part: How does Log Insight send an alert to vROps and how does vROps know which object to assign the alert to?

Look at this event:

Simple vRealize Log Insight query filtering for NSX-T alert 'Edge CPU Usage Very High'

See that little blue ‘source’. That’s a magic field and source is who sent the event to Log Insight. In this case it’s nsxmgr-01a.corp.local. There is also ‘hostname’, which often matches source.

The vRLI / vROps / NSX-T problem is exposed.

This info is passed over to vROps and the event is assign to the object with this name. This is part of the problem. The customer process doesn’t want the alert to be raised against the NSX manager if the problem is with a NSX-T service. In this example it’s marginally important but in an customer that spans countries, having a problem with a Tier0 gateway and getting the alert assigned to a Edge node, whilst your ITSM is looking for the Tier0 gateway problem is not helpful.

Do you see another problem?

This event extract is reporting a CPU problem on Edge node 9b0f61d9-5543-b468-e1f2bf087b64, which is nice. Imagine Roberta. Nice lass. Works on the helpdesk nightshift. Is Roberta going to know what that ID is? Does that tell her who to call out? How serious is it that 9b0f61d9 has gone wrong? Yes the answer is in NSX-T but helpdesk probably isn’t going to have access to the NSX-T management console. Still, keeps me in a job and that’s a problem for another day.

Anyway I digress. Lets take a look at setting up my query as an alert and sending it to vROps:

Sending an alert from vRLI to vROPs configuration screen.

Looks like we need a fallback object. A fallback object is a default object within vROps that an alert can be allocated to if vROps doesn’t identify the passed object to assign the alert to. This is important if you’ve got something like a physical edge device, which vROps will not have any concept of because vROps isn’t monitoring physical devices.

So lets pause vRLI at this point, because we need a fallback object and that’s done in vROps.

vRealize Operations

And so we arrive to vROps. We need to create a fallback object. The easiest way is to create a Custom Group and then configure it in such a way that it doesn’t actually have any vROps object inside it.

After a cup of coffee and a cheeky biscuit (chocolate hobnob no less!) I created two new custom group types (vROps | Administration | Configuration | Group Types).

Two new custom group types inside vROps.

The custom group will be of the type NSX-T Fallback Objects and it will be a static group consisting of NSX-T Fallback Members.

What’s a NSX-T Fallback Member? Nothing. A placeholder that should never exist. Perfect for populating empty groups.

Now we can create the custom group.

Notice that it’s of the custom group type NSX-T Fallback Objects, it’s a static group (keep group membership up to date is not checked) and it’s looking for NSX-T Fallback Members, which should never exist. Excellent. A custom group that will never be populated but is a perfectly formed object.

Back to..

vRealize Log Insight

We left this sat waiting for us to fill in the Fallback object.

Click on ‘Select’ and change the drop down to ‘All Objects’ and then just search for and select the Fallback Object we just created in vROps

Make sure you change from Active Objects to All Objects
Select the vROps Fallback object just created.

Sending a Test Alert will appear against the Fallback object so you can use this to see if it works. This can take 5 minutes to appear in the Alerts window in vROps.

Sending a test alert to vROps from vRLI

Hammering it multiple times will cause vROps to group the test alerts together so you get multiple symptoms for a single vROps alert.

The VRLI test alert in vROps

Excellent, job jobbed. We can pickup the alerts from the NSX-T logs inside vRLI. Then use vRLI to send them on as alerts into vROps with them assigned to either the source of the event or a Fallback object.

Well not quite. This isn’t scalable and the single Fallback object will mask which object we actually need to assign the alert to. And it needs to be consistent and some alerts to virtual edges and some alerts to a fallback isn’t consistent (or consistently wrong depending on your POV).

It’s time to get creative and review the basics.

vROps creates objects based upon what it ‘sees’. vROps ‘sees’ the vSphere world via the vCenter and most logs will be attached to the vCenter VM objects (because from vRLI’s POV it’s a virtual machine that sent the alert, not a service). So vRLI alerts will be raised against a VM or the Fallback object.

What if we removed the permission of the vROps service account to see the NSX-T VM? Well, vROps doesn’t create an object for that NSX-T VM which means when vRLI passes it an alert it’s going to have to assign it to the Fallback object.

What if we created a Fallback object for every NSX-T device we need to alert against? Then we’re raising vRLI NSX-T alerts against specific Fallback device based upon the vRLI alert query. If we added a ‘hostname’ filter then we can assign specific Fallback objects for individual alerts.

Now that’s all good and proper, but that’s massive manual operations. Nobody wants to be doing this (or nobody should be doing this).

Therefore we need a workflow. Something like:

NSX-T alerts to vROps alerts in a workflow.

Amazing.

Can we code and therefore automate this? Yes we can. Both vRLI and vROps have REST APIs which can do this. vCenter has an SDK which can manipulate permissions on objects. I’m not going to look at the vCenter code; vCenter 7 has Code Capture and you can just enable this, record yourself editing the permissions on a VM and then review the code output in several languages (Powershell, Python, Javascript etc).

Code, Scripting, face-planting on the keyboard

vRealize Operations

To begin with lets look at the vROps code and I’m going to make the following assumption:

  • The object has already been removed (if it existed) from vROps

First we need to setup our REST API headers

vRealize Operations Headers

Content-Typeapplication/json
Acceptapplication/json

Once the token has been created we will add:

AuthorizationvRealizeOpsToken <TOKEN>
Generating a vRealize Operations login token
MethodPOST
URLhttps://<vrops-fqdn>/suite-api/api/auth/token/acquire
Body{
  “username” : “<username>”,
  “password” : “<password>”
}

This generates a response, with the token highlighted:

{“token”:”c60b962c-1b1b-4a48-b1d1-14412eb08402::37b247b1-02b2-4e5a-87d5-6936c99aea9c“,”validity”:1628700487274,”expiresAt”:”Wednesday, August 11, 2021 4:48:07 PM UTC”,”roles”:[]}

Therefore the Authorization header looks like this (and remember to remove the body with the username / password):

AuthorizationvRealizeOpsToken c60b962c-1b1b-4a48-b1d1-14412eb08402::37b247b1-02b2-4e5a-87d5-6936c99aea9c

Now we can create the static group type.

Creating a Static Group Type

The custom group type enables all NSX-T fallbacks objects to share an object type. This provides opportunities for data manipulate later. Both commands only need to be run once per vRealize Operations installation.

MethodPOST
URLhttps://<vrops-fqdn>/suite-api/api/resources/groups/types
Body{
  “name” : “NSX-T Fallback Objects”,
  “others” : [ ],
  “otherAttributes” : { }
}

This call creates a second custom group type. This enables the population of the custom groups with empty, static memberships.

MethodPOST
URLhttps://<vrops-fqdn>/suite-api/api/resources/groups/types
Body{
  “name” : “NSX-T Fallback Member”,
  “others” : [ ],
  “otherAttributes” : { }
}

If an attempt to create the group is performed and it already exists then a response code 500 is generated which means the object already exists.

Creating a Custom Group

The custom group is an object that can be built to have either a dynamic or static membership. These objects can have no members but are suitable for an alert to be raised against it.

The following extract builds a custom group with a static membership based upon the custom group type created in the previous code extract.

In this extract the “name” would need to be amended as required.

MethodPOST
URLhttps://<vrops-fqdn>/suite-api/api/resources/groups
Body{
  “resourceKey” : {
    “name” : “NSX-T FB – Virtual Edge 1”,
    “adapterKindKey” : “Container”,
    “resourceKindKey” : “NSX-T Fallback Objects”,
    “others” : [ ],
    “otherAttributes” : { }
  },
  “autoResolveMembership” : false,
  “membershipDefinition” : {
    “includedResources” : [ ],
    “excludedResources” : [ ],
    “custom-group-properties” : [ ],
    “rules” : [ {
        “resourceKindKey”: {
          “resourceKind”: “NSX-T Fallback Member”,
          “adapterKind”: “Container”
      },
      “statConditionRules” : [ ],
      “propertyConditionRules” : [ ],
      “resourceNameConditionRules” : [ ],
      “relationshipConditionRules” : [ ],
      “others” : [ ],
      “otherAttributes” : { }
    } ],
    “others” : [ ],
    “otherAttributes” : { }
  },
  “others” : [ ],
  “otherAttributes” : { }
}

If we try to create the group and it already exists then a response code 500 is generated, which means the object already exists.

So we’ve now got REST API code extracts for creating the two vROps group types and we’ve created a group also using the REST API. Time for another shot of caffeine.

vRealize Log Insight

Ok I had another hobnob as well.

As before we need to setup our REST API headers

vRealize Log Insight Headers

Content-Typeapplication/json
Acceptapplication/json

Once the token has been created we will add:

AuthorizationBearer <TOKEN>
Generating a vRealize Log Insight login token
MethodPOST
URLhttps://<vrli-fqdn>/api/v1/sessions
Body{
  “username” : “<username>”,
  “password” : “<password>”
}

This generates a response, with the token highlighted:

{“userId”:”45fd3625-b9b5-4ef4-8f4c-1022e82d20dd”,”sessionId”:”Hom8ZlThpPTLZa79cCJmHsMVqbx0Dvopmi35wvVBQneP+1yvhI+aUmL7Hw6bdGo02pK/MKDtRuf3CeYum7qs/hIYpzQtKOhxjVd2cjW24/TINEYQhJ0ebYp4fD4oajmQ+n28d1iwdPGxP+k+gzLwCDA/nm7B80Vge/QP6v8DrW0KUH5Jn15COjKikMC/9kt56gx20NWpHcLM6Hjxt0CHI4VDY2AWy18hDkHjZbs27Wr2vcwjkb6MnpDI4M9Y9KV6xo0Wk71Kqeo4YwEZKMHYxA==“,”ttl”:1800}

As before cleanup the body and add the Authorization header.

Alert Creation

When creating the alerts the following is the general format and the body section is detailed below.

MethodPOST
URLhttps://<vrli-fqdn>/api/v1/alerts
Body{
  “name”: “NSX-T Alert – Edge CPU Usage Very High”,
  “info”: “”,
  “recommendation”: “”,
  “enabled”: true,
  “vcopsEnabled”: true,
 “vcopsResourceName”: “NSX-T FB – Virtual Edge 1”,
  “vcopsResourceKindKey”: “resourceName=NSX-T FB – Virtual Edge 1&adapterKindKey=Container&resourceKindKey=NSX-T Fallback Objects”,
  “vcopsCriticality”: “critical”,
  “alertType”: “RATE_BASED”,
  “hitCount”: 0.0,
  “hitOperator”: “GREATER_THAN”,
  “searchPeriod”: 300000,
  “searchInterval”: 300000,
  “autoClearAlertAfterTimeout”: false,
  “autoClearAlertsTimeoutMinutes”: 15,
  “chartQuery”: “{\”query\”:\”\”,\”startTimeMillis\”:1625842439130,\”endTimeMillis\”:1628600280387,\”piqlFunctionGroups\”:[{\”functions\”:[{\”label\”:\”Count\”,\”value\”:\”COUNT\”,\”requiresField\”:false,\”numericOnly\”:false}],\”field\”:null}],\”dateFilterPreset\”:\”CUSTOM\”,\”shouldGroupByTime\”:true,\”includeAllContentPackFields\”:false,\”eventSortOrder\”:\”DESC\”,\”summarySortOrder\”:\”DESC\”,\”compareQueryOrderBy\”:\”TREND\”,\”compareQuerySortOrder\”:\”DESC\”,\”compareQueryOptions\”:null,\”messageViewType\”:\”EVENTS\”,\”constraintToggle\”:\”ALL\”,\”piqlFunction\”:{\”label\”:\”Count\”,\”value\”:\”COUNT\”,\”requiresField\”:false,\”numericOnly\”:false},\”piqlFunctionField\”:null,\“fieldConstraints\”:[{\”internalName\”:\”text\”,\”operator\”:\”CONTAINS\”,\”value\”:\”eventState=On\”},{\”internalName\”:\”text\”,\”operator\”:\”CONTAINS\”,\”value\”:\”eventType=edge_cpu_usage_very_high \”},{\”internalName\”:\”text\”,\”operator\”:\”CONTAINS\”,\”value\”:\”eventSev=critical\”},{\”internalName\”:\”text\”,\”operator\”:\”CONTAINS\”,\”value\”:\”eventFeatureName=edge_health\”},{\”internalName\”:\”text\”,\”operator\”:\”CONTAINS\”,\”value\”:\”The CPU usage on Edge node\”},{\”internalName\”:\”text\”,\”operator\”:\”CONTAINS\”,\”value\”:\”which is at or above the very high\”}],\”supplementalConstraints\”:[],\”groupByFields\”:[],\”contentPacksToIncludeFields\”:[{\”name\”:\”VMware – NSX-T\”,\”namespace\”:\”com.vmware.nsxt\”}],\”extractedFields\”:[]}”
}

Wow. Is that formatted? Yes. That’s what it needs to be. That final line starting “chartQuery” is all one line, and all the actual magic happens inside that line.

The code highlighted in blue are the constraints (the text filters) used to define the query and you can see the several text filters that I’ve used to ensure an accurate identifier.

NOTE: These filters are not looking for a specific Source or Hostname so it’s a more generic alert. I’ll leave it up to the reader to adjust this as required.

The code highlighted in green shows that I’m not looking for these filters in all the content packs, only the NSX-T content pack.

In Summary

The customer was having a problem with NSX-T alerts appearing in vROps in a fashion that was incompatible with their downstream ITSM software. This exercise was theoretical to see if we could get something working within their environment or if they would need a different solution. As you can see we have managed to get the alerts from NSX-T to vROps via VRLI, all using Out Of The Box (OOTB) functionality and assigned consistently to a specific fallback object (again OOTB), which can then be picked up via their ITSM integration (with some minor adjustment on their side). We then enhanced this theoretical solution by ensuring that it can all be coded and automated so no poor soul has to do this manually and fits into their everything as code methodology.

And we had fun. My wife just asked if we have any chocolate hobnobs left, we do not.

IT Service Management

I’ve been quiet for a while, partially because there’s not much been going on. I’ve been busy but with more normal everyday stuff and partially because I’ve switched focus in my day job and I’ve been caught up in a new language, new concepts.

Before I get into it, indulge me. This a personal blog. Everything that appears here is my own opinion and doesn’t represent any position of my employer.

Several posts ago I wrote about service monitoring. It was actually intended to be a small intro into a series about service management that never got beyond several drafts. More recently I was discussing what I see as a failure of the IT industry in general; overall the industry is product focused. Every product is sold with new features as the selling point; do this better, look at this new wavy line. Business units are organised into teams (aka silos) each focused on making their software better. Nothing wrong with this at all, it’s been very successful but that’s not whats happening in the wider world.

A long time ago (in a galaxy far far away), or, about 8 years ago in Daventry (Northamptonshire, UK), I was presenting and took 5 minutes out to discuss what I termed ‘the commoditisation of IT’; the wider adoption of IT into general public usage was in part driven by the simplification at the point of consumption and the trend towards subscriptions. I used the Apple iPhone and App store as an example how complex IT was now common across different generations, easily usable, giving rise to expectations that this is how IT is done, which was a vastly different perception to what we, as a collection of IT professionals, knew actually occurred.

In the following years a number of my observations have been accurate; throw enough darts and you’ll hit the bullseye occasionally. The world is moving towards subscription. There’s an excellent book called ‘Subscription’ by Tien Tzuo that’s much more articulate about the direction of services that I will ever be.

Businesses continue to look for opportunities to exploit, to generate money and deliver goods and services. With the COVID pandemic changing the nature of how businesses go to market, changing what and how consumers consume it’s becoming apparent that more flexible ways of working are required.

What has this got to do with IT?

IT isn’t immune to COVID. Some products will become less important, some products will rapidly become more important (remote productivity and collaborate tools such as Zoom for example) and this will impact on how IT departments deliver these products. This change isn’t new because of COVID. It was already happening, but COVID is simply increasing the speed that it needs to happen.

Professional Services, as typically performed today, is dead.

The last two decades have seen the creation of in-house IT departments with vendor Professional Services teams delivering product focused solutions into production. This would typically be based around the simplified lifecycle:

  • Design
  • Install
  • Configure
  • Knowledge Transfer

At some point the lifeycle repeats and we come back and do it again.

Until that time the customer IT teams are often on their own, occasionally interfacing with support teams. Product adoption into daily use can be pitifully low. Vendors ship more complex SKU’s with more products bundles together and the ‘value’ products, if they are installed at all, get ignored. I’ve heard it called shelf-ware, as in they never leave the corporate shelf.

The products, individually very powerful, don’t really link up, because they are often developed by separate business units, brought together under a singular brand name via corporate acquisition, resulting in strange bedfellows and outright incompatibility. This mixture of paper based excellence and real world disappointment creates inefficiencies and is accentuated by siloed IT responsibilities. The result is the business needing and trying to go faster, whilst the IT is moving slower.

If any of this is shocking, it shouldn’t be. We’ve known about this for a while.

Back in 2006 Amazon launched AWS. Subscription based IT. Someone else would host your infrastructure, featuring a fairly simple interface, similar to an App store experience, with a quick delivery time. All you needed was a credit card for the ongoing cost and the game changed.

Today when launching a new initiative a business needs to decide if it wants to launch using a public cloud provider or the using its internal IT capability. There are many factors to which is preferred but the general industry trend is that cloud based operational expenditure is better. In my opinion businesses prefer the simplicity, cost and speed of a hosted solution.

And this impacts Professional Services how?

As more businesses make the decision to use public cloud, as more businesses become comfortable with hosted solutions, the pool of companies that want in-house IT shrinks. Eventually it will be companies that operate at a scale, or operate within a market where compliance / regulatory requirements means true public cloud isn’t viable. That’s probably a small pool of potential customers.

Decorative, showing none-numerical pie charts illustrating the shrinking of the Professional Services market space.
The on-prem market for Professional Services is shrinking as cloud becomes more ubiquitous

Professional Services is primarily delivering Design / Install / Configure services.

Design

Everyone has best practices. In reality this means that unless you have some strange requirement you will be following best practices. It’s in almost every design document; ‘Unless a documented requirement prohibits it, follow best practices’. Therefore unless the business requirements are entirely left-field most designs look very similar. Professional Services are finding those areas that can’t match the best practices and are helping customise the solutions to compensate.

With Public Cloud based solutions there’s probably some network design around ensuing on-premise to cloud based connectivity and maybe some inter-cloud connectivity but intra-cloud connectivity will be handled via the provider and you won’t typically be architecting their solution. If it doesn’t meet your requirements then you go find a cloud that does.

Install and Configure

This will get automated. We’re already heading in this direction with Infrastructure-as-code. it needs some polish as the monolithic older applications get modernised but this is inevitable. The configuration will also move into Lifecycle Management software and capabilities.

This is what occurs in VMware’s VCF today. The VCF deployment tool deploys vRealize Lifecycle Manager which in turns deploys the rest of the vRealize suite and begins to lifecycle manage those deployments.

With cloud-based providers you don’t install anything. Create your account, grab your authentication token and off you go to the races. If you encounter any problems there’s a chat window for you to speak to a AI-augmented support engineer.

Knowledge Transfer

This still needs to be done, but as the tools become more intelligent and automated the focus of the knowledge transfer needs to change.

So I’ll repeat my opinion. Professional Services, as typically performed today, is dead.

The successful delivery of IT is a complex dance of three pillars. People, Process and Technology. As I’ve mentioned previously the IT industry is generally product (Technology) focused.

With the Technology moving heavily into automation and Infrastructure-as-code that means we need to start looking at People and Process. Some companies are good at this, most are not, and I believe Professional Services needs to get into the game. This is the new knowledge transfer. How to ensure that IT departments are structured to compete with the Cloud based providers, delivering IT as smoothly as AWS / Azure can. To ensure that a valid, IT Service Management function, is wrapped around IT operations.

To do this we need to develop new language. Think about things in different ways, to deliver IT as a set of services with clear lines of management. IT Service Management. To help the customer organise themselves and build their existing capabilities into services that can be linked back to business requirements.

And this is what I’ve been doing. I’ve been thinking about it for a while and now I’ve grabbed an opportunity to dive headlong into this world and get immersed in the new terminology and new ways of thinking about IT and I’ll be posting in my usual timely fashion about this new world.

So long live Professional Services. The kings of transformation.

Allocation Model in vROps 7.5+

History Recap: In vRealize Operations 6.7 the capacity engine was re-engineered and the Allocation modelling capability was removed before being re-added in vRealize Operations 7.5. There’s no Allocation in vRops 6.7 to 7.0. You also need to enable Allocation in the policies in vROps 7.5, it’s not turned on out of the box (OOTB).

There are two primary classifications of reviewing capacity within vRealize Operations:

Demand – Capacity based upon the actual requested resource consumption (i.e. demand). Demand-based modelling is typically used by Managed Service Providers (MSP) as it represents the actual usage of the environment which has been licensed to other users. The more accurate the model. the more resources can be sold and the more money is made (let’s be honest it’s about the money!).

Allocation – The total consumption of a resource if it theoretically was used at 100% all the time. This is an older model that can be much simpler as it’s essentially just a subtraction from the total capacity. I typically find allocation in larger organisations where the IT infrastructure supports various different business organisations and cross-charging (or chargeback) is performed to help offset the IT costs. It’s also much easier to plan with as simply when it gets up to roughly ~75% allocated, you buy more hardware.

I’m going to talk about the Allocation model. As I see it, the allocation model has two primary use-cases, each with its own distinct event horizon (this is my terminology):

Short event horizon: I’m deploying new objects (VMs / Containers / whatever) right now or in the next few days. I need to know what the available capacity is right now. Therefore my usable capacity must exclude all resource providers (hosts, storage etc) that are not contributing (aka offline, in maintenance mode etc) to the capacity.

Long event horizon: I’m deploying new objects in a year. This is important when it takes a long time to purchase and prepare new hardware. Therefore my usable capacity should take the assumption that all of the resource providers are online and available. There’s probably no reason (I have one or two TBH, but that’s not the point here) for a resource provider to be offline / in maintenance mode for an extended period of time.

The Allocation model in vROps 6.6.1 was based upon the long event horizon. Hosts that where in maintenance mode were included in the usable capacity metrics.

The Allocation model in in vROps 7.5+ is based upon the short event horizon. Hosts that are in maintenance mode are not included in usable capacity.

vROps 8.1 Allocation Usable Capacity

Is this a problem?

It depends on the exact methodology used when trying to do long term planning. In large environments it’s a constant job to lifecycle manage the underlying infrastructure. There are almost always hosts in maintenance mode for patching and the inevitable hosts that are just going pop (at night, it’s always at night!).

It’s also worth remembering that the capacity planners (long-term) are not the same people that are often doing the deployments (short-term). There’s a whole raft of reasons the capacity planners might not even have access to vROps (operational, cultural, procedural), so the long term capacity planning might actually be done via data extract and not the UI. So that lovely ‘What-if’ functionality isn’t used (DevOps and SREs are typically code driven).

What does this affect?

This behaviour is seen in the following two metrics:

  • CPU|Allocation|Usable Capacity after HA and Buffer
  • Memory|Allocation|Usable Capacity after HA and Buffer

As far as I’m aware Disk Space|Allocation”Usable Capacity after HA and Buffer doesn’t have this behaviour (as you’d expected TBH).

I have this problem, what can I do about it?

In the most basic long term allocation modelling it’s fairly straight-forward to model using supermetrics.

For example, let’s talk about CPU.

The allocation model, at the cluster level, models CPU capacity as vCPU. That is the total number of vCPU that can be deployed.

The standard OOTB metric for this is ‘CPU|Allocation|Usable Capacity after HA and Buffer‘ and it will show a usable capacity and this metric will vary depending on if hosts are in maintenance mode <See image above>.

Lets build a basic replacement that doesn’t care if hosts are in maintenance mode.

This calculation can be something fairly simple as:

((CPU|Number of physical CPUs (Cores) * ratio) * Cluster Configuration|DAS Configuration|Admission Control Policy|CPU Failover Resource Percent)) – (((CPU|Number of physical CPUs (Cores) * ratio) * Cluster Configuration|DAS Configuration|Admission Control Policy|CPU Failover Resource Percent)* buffer)) = Cluster Usable Capacity vCPU

Let’s use some numbers to see how this works. I’ve assumed the following (OOTB represents the vROps OOTB metric name if you need it):

  • Number of hosts in a cluster = 12
    • (OOTB: Summary|Total Number of Hosts)
  • Number of cores per host = 20
  • Number of physical CPUs in a cluster (or cores * hosts) = 240
    • (OOTB: CPU|Number of physical CPUs (Cores)) – this is variable though as it excludes hosts in MM.
  • Desired Ratio = 4:1
  • HA FTT = 1 Host
    • (OOTB: Cluster Configuration|DAS Configuration|Admission Control Policy|CPU Failover Resource Percent)
  • vROps additional Buffer = 5%

To the math:

(Total Hosts * Cores per host) = 240 physical cores (or OOTB: CPU|Number of physical CPUs (Cores))

240 * Ratio (4:1) = 960 vCPUs Total Capacity

(This could be a cool SM if you wanted to know the total number of vCPUs for a cluster, which vROps currently doesn’t tell you).

960 vCPU TC – OOTB: Cluster Configuration|DAS Configuration|Admission Control Policy|CPU Failover Resource Percent (8%) = 960 * 0.92 = 883.2 vCPU

883.2 * vROps buffer (5%) = 883.2 * 0.95 = 839.04 vCPU

Wrap the whole metric in the floor() function to get 839 vCPU as your usable HA content that will not change if hosts are in maintenance mode.

You can do something similar for Memory|Allocation|Usable Capacity after HA and Buffer as well, and that should be simpler.

NOTE: I’ve simplified the calculations above from the eventual supermetric customer delivered supermetric, and due to the hosting platform I currently can’t get formula’s to look nice so a few brackets might be misplaced.

How complicated can the supermetrics get?

Very very complicated depending on your particular requirements. Go beyond the very basics and it can include vROps SM if statements, which statements, arrays. Quite advanced supermetric stuff and if you really want to go to town, calculations scripted outside of vROps and then inserted into vROps.

If you’re really struggling I would recommend engaging with VMware about getting Professional Services involved.

Use Policies to migrate content between vROps instances

It’s been a minute since I last posted. So today I thought I’d just briefly outline how it’s possible to migrate some content between vRealize Operations deployments.

The content management cycle for vROps can leave a little to be desired. With policies, alerts, views, symptoms, recommendations metric configuration, supermetrics, reports and dashboards, there’s little inbuilt capability to quickly extract relevant objects and import to another vROps instance.

But you can use a policy to quickly migrate policy settings, supermetrics, alert definitions, symptoms and recommendations.

Here’s the basic process:

  • Build a new template
  • Enable locally in the policy all the supermetrics required
  • Enable locally in the policy all the alerts required
  • Export the policy as an .xml
  • Import the policy into the new vROps

That’s ok, but that’s for one policy. What about multiple policies?

Export them as before. Then open up the .xml and copy the <policy> branch to the import template file, adding the extra text ‘parentPolicy=”<ID of the master policy>”.

Nested vRealize Operations Export

In the image above I’ve exported five additional policies, and then added them to my import .xml file. Of key importance is how I’ve added the line parentPolicy=”eac91bc-4be7-487d-b1da-63dc6f5e25e8″ which matches the key of the top-level policy.

When this .xml is imported all the children are also imported.

Policy imported to new vROps

Then it’s possible to to just pick the new policy and apply the appropriate imported policy.

Build the new policy, ensuring that the policy will use the appropriate base policy.

Building a new local policy

Override the settings with the settings from the appropriate imported policy

Overriding the settings with the imported values

And voila, quickly and easily migrate policies, alerts and supermetrics between vROps instances.

A migrated policy ready to be used

vROps HA / CA clusters

Have you recently cast your beautiful eyes over the sizing guides for vRealize Operations 8.X? Of course you have; it’s mandatory reading. A real tribute to the works of H.G. Wells & H. P. Lovecraft.

Recently I was reviewing a vROps 8 design and the author had added a section on Continuous Availability (CA). The bit that caught my eye was a comparison table between CA and HA. Mostly specifically the maximum number of nodes. Something didn’t add up. Lets take a closer look:

vRealize Operations 8.0.1 HA Cluster Sizing
Figure 1. vRealize Operations HA Cluster Sizing
vRealize Operations 8.0.1 CA cluster sizing table.
Figure 2. vRealize Operations CA Cluster Sizing

Lets review the design guidance for a CA cluster:

Continuous Availability (CA) allows the cluster nodes to be stretched across two fault domains, with the ability to experience up to one fault domain failure and to recover without causing cluster downtime.  CA requires an equal number of nodes in each fault domain and a witness node, in a third site, to monitor split brain scenarios. 

Every CA fault domain must be balanced, therefore every CA cluster must have at least 2 fault domains.

So far that’s all fairly easy to follow but the numbers don’t align. An extra-large vROps HA cluster has a maximum number of nodes of 6 (the final column in Figure 1). The maximum number of nodes in a single fault domain is 4 (the final column in Figure 2). The minimum number of fault domains in a CA cluster is 2, therefore the total number of nodes in a CA cluster is 8.

Surely this is a mistake?

I asked the Borg collective for assimilation. They said no but did tell me, and I paraphrase:

The maximum number of nodes for vROps 8.X are different depending on if you are using HA or CA although the overall objects / metrics maximums are unchanged.

So, in conclusion, there is no increase in the objects or metrics that a CA cluster can support compared to a HA cluster. So the total supported* capacity remains the same, you can just have more nodes to support the CA fault domain capability.

*Obviously you can go bigger, but VMware support can tell you off.

*EDIT*

I’ve edited this post since it was originally posted to add some additional context and tidy up some of the language.

vRealize Network Insight and Certificates

Amongst the many tools that I tinker with exists vRealize Network Insight, aka vRNI (vern-e), aka Arkin. VMware bought Arkin back in 2016 and it became the vRNI that we know and love today.

vRNI has a slightly different architecture model to vROps. It consists of a platform component and some proxies / collectors.

The proxies / collectors (for they appear to be having something of a rebrand and are called both interchangeably at the moment) connect to the datasources, collect information, do some pre-processing and forward that data onwards to the platform.

There are two major differences to how vROps Remote Collectors work. vRNI collectors:

  • Do some pre-processing and statistic generation.
  • Store information in the event that the platform isn’t available.

The most basic deployment looks like this:

vRealize Network Insight basic deployment
vRNI basic deployment concept

The Collector connects the the vCenter, NSX and the physical network and sends the data to the platform. The platform consists of a single node. The end-users will only ever talk to the platform system.

More advanced deployments will need more platform nodes (thats not a revelation btw), so an advanced one might look like this:

vRealize Network Insight Advanced Deployment Concept
vRNI Advanced Deployment Concept

NOTE: There’s no reason why you would need three platform nodes for a single collector.

The important point to see here is that the three platform nodes are fronted by a load balancer. The end-user would then be sent to the most appropriate platform node as determined by your LB config.

There are a few things to note about building a vRNI platform cluster:

  1. It’s not a HA cluster, it’s a performance cluster. There’s NO HA in vRNI. Lose a single node and your cluster is offline.
  2. The UI is presented from Node 1, you can log via other nodes, but AFAIK you’re being proxied to Node 1

That last point is my understanding of the behaviour of vRNI.

You now have some concept of the vRNI cluster, lets get to the topic of the post; certificates.

VMware have a lifecycle product for the vRealize suite of products called vRealize Suite Lifecycle Manger (vRSLCM, yes it has an ‘S’ in the acronym and yes, no other vRealize Suite product does).

In an ideal world you would be using vRSLCM to handle things like pushing certificates because it makes it really easy and by default all VMware products have self-signed certificates. Because you are replacing the self-signed certificates? Right…

The format for the certificate is the normal straight forward configuration:

  1. The Common Name is the FQDN of the load-balancer URL
  2. The SAN names are the FQDN of the LB and the 3 platform nodes

And the process is the normal procedure:

  • Generate the .csr, send it off and get the SSL cert back.
  • Build the full certificate (service certificate / private key / intermediary CA, root CA).

Upload it to vRLSCM and off it goes and replaces the self-signed certificate. You can log in to Node 1 and it works.

Success.

You check Node 2 and… warning, same with node 3.

Earlier I mentioned that vRNI UI is only on Node 1. vRSLCM only replaces the certificate on Node 1:

vRealize Network Insight with certificates updated.
vRNI certificates replaced

So that’s unexpected, makes sense if node 1 is the only UI server, but annoying. I’m wondering if it’s possible to update the certificates on the other nodes manually. You can certainly update the certificate manually on a single node. That’s fairly easy and the same process should work for the other nodes.

If I decide to do this I’ll make sure to blog about it.

vROps and VCD – Speaking a common language

What’s this? Another blog entry. Clearly I’m not busy.

For the last few years I’ve been helping a few telcos (mobile phone providers for the layman) with their monitoring requirements for the various platforms (4G and 5G). At this point they’ve been using VMware’s NFV bundle, which consists of vSphere (or Openstack), vSAN, NSX, vROps, vRLI, VRNI (optional) and VCD. Whew that’s a lot of product acronyms and it includes VCD; aka VMware Cloud Director or vRA for people that need multi-tenancy.

WARNING, that’s a massive simplification of both products but hey I do monitoring, automation was a decade ago using scripts and powershell, I don’t need vRA or vRO to build VCF (/rasp).

But wasn’t VCD discontinued? Err, yeah but no. Dull story about business requirements and market opportunities, blah blah blah. Anyway, it’s still around and it’s good if you need it.

A few things about how VCD structures stuff. The underlying physical hardware is grouped into normal vSphere clusters. This is presented via VCD as a Provider VDC (VDC = Organisation Virtual DataCentre). The PVDC is then used to provide the resources to a group called the Organisation VDC. The OrgVDC is basically a resource pool, with reservations and limits, that a end customer, called a tenant, can then consume.

Clear.

Nope. It can be complicated and they use totally different names for vSphere constructs. I was going to make a picture to illustrate this, but I stole one a long time ago (apologies to whomever made this but it’s mine now. I licked it):

vCIoud Director Constructs
Not my image of VCD constructs.

To adequately monitoring this you need to connect vROps to VCD. There’s a management pack for this. You need to be very careful to get the correct management pack that supports the version of VCD. There are two components:

  • The management pack which connects to VCD
  • The tenant OVA, which is an appliance which is a static application that merges data from VCD and vROps into a few static dashboards for tenants (end-users).

I’m going to talk about the VCD MP.

Firstly; the VCD MP that is compatible with vROps 6.7 does not capture metadata from VCD. It’s also incomplete and uses (or used it might have finally been fixed) the VCD User API interface not the VCD Admin API so its missing various metrics (or it has bugs some may say). You can script around this and then inject the metrics into VCD. Kinda cool, but its custom and GSS fear the word ‘custom’.

vROps 7 and its associated VCD MP fixed a bunch of these issues. To collect the metadata enable ‘Advanced Metrics’ in the VCD MP configuration in vROps.

Now for the ‘fun’ stuff.

A OrgVDC in VCD can be Reservation or Pay-As-You-go and they have the ability to guarantee resources.

Guarantee.

Don’t recall seeing that in vSphere and vROps; because it’s not a term we use.

Lets look at a typical Reservation pool OrgVDC configuration:

An example of a VCD reservation pool OrgVDC
VCD reservation pool OrgVDC

There’s a few things we can see that are useful:

  • CPU Reservation Used
  • CPU Allocation from the PVDC
  • Memory Reservation Used
  • Memory Allocation
  • Maximum number of VMs

But they’re not named similar in vROps. Because that would be too easy. All vROps metrics are from the OrgVDC object.

VDC Label NameVDC ValuevROps MetricvROps Value
CPU Reservation Used424.76 GHzCPU|Used (MHz)424,760
CPU Allocation650 GhzCPU|Allocation (MHz)650,000
Memory Reservation Used1,256.77 GBMemory|Used (GB)1,256.7744
Memory Allocation2048000 MBMemory|Allocation (MB)2,048,000
Max number of VMsUnlimitedGeneral|Max Number of VMs0
VCD-2-vROps Reservation Pool

That’s not so hard. Nope, Reservation is fairly straight-forward. But Pay-As-You-Go (PAYG) is a different story.

PAYG can use quotas to allocation resources, and then allows a percentage of that quota to be guaranteed. To further up the ante it also allows for a different vCPU speed to be used against what’s actually in the physical server.

Lets get some numbers.

I have 1 cluster with 7 hosts, each host has 2 sockets and 18 cores per socket (36 logical processors). My socket speed is 3Ghz. This gives my cluster 756000 ((36 * 3000)*7) cycles total capacity. I can set the quota in VCD to unlimited (use all of it) or a set below it, but for simplicity I’ll set it to unlimited, so my single OrgVDC can use all 756Ghz (and don’t forget you can allocate multiple OrgVDC to a single PVDC. Do you hear contention?), but I’ll set a guarantee of 90%. On top of that I don’t want to tell VCD it’s using 3GHz processors, but 2.55Ghz processors.

Something like:

An example from VCD of a PAYG Pool OrgVDC
VCD PAYG Pool

As before there’s interesting and useful data here about how I INTEND my environment to be consumed:

  • CPU Allocation Used
  • CPU Quota
  • CPU Resources Guaranteed
  • vCPU Speed
  • Memory Allocation Used
  • Memory Quota
  • Memory Resources Guaranteed
  • Maximum number of VMs

To vROps we go:

VDC Label NameVDC ValuevROps MetricvROps Value
CPU Allocation Used688.50 GHzCPU|Used (GHz)688.5
CPU QuotaUnlimited<NOPE><NOPE>
CPU Resources Guaranteed90%<NOPE><NOPE>
vCPU Speed2.55 GHzCPU|vCPU Speed (GHz)2.55
Memory Allocation Used2,269.00 GBMemory|Used (GB)2,269
Memory QuotaUnlimited<NOPE><NOPE>
Mem Resources Guaranteed90%<NOPE><NOPE>
Max number of VMsUnlimitedGeneral|Max Number of VMs0
VCD-2-vROps Reservation Pool

Well that’s unexpected. How can you monitor your VDC PAYG models when vROps doesn’t have appropriate metrics?

Time for a cup of tea.

Defiantly not coffee.
Real people drink coffee

What is the quota?

The quota is the maximum amount of resources that can be consumed. An OrgVDC can never use more than the parent PVDC can provide. So any quota that is unlimited is essentially limited to the PVDC value.

If the OrgVDC has got a quota set (not unlimited), then CPU|Allocation and Memory|Allocation should be the vROps metrics (75% sure; my notes are unreadable on this).

Getting the parent PVDC to a OrgVDC is a supermetric. That’s not so difficult:

min(${adaptertype=vCloud, objecttype=PRO_VDC, metric=cpu|total, depth=-1})

The ‘depth=-1’ means go upwards, aka my parent. Apply to all OrgVDC’s and now you know how much capacity the parent has (for CPU in this example).

How to find Guarantee we need to understand how VCD relates to VMs:

pVDC -> orgVDC -> vApp -> VM

The similar vSphere relationship:

vCenter -> DataCentre -> Cluster -> Resource Pool -> vApp -> VM

But vROps is getting information from vSphere and where does vSphere set reservations and limits; on Resource Pools or individual VMs. VCD uses the limits and reservations on a VM.

Therefore you need two more supermetrics (or four: 2 for CPU and 2 for RAM);

  • One to create a reservation total for each vApp (based on the sum of all vApp child VMs), applied at a vAPP object.

sum(${adaptertype=VMWARE, objecttype=VirtualMachine, metric=config|cpuAllocation|reservation, depth=1})

  • One to sum the vApp SM for the OrgVDC, applied at an OrgVDC object.

sum(${adaptertype=vCloud, objecttype=VAPP, metric=Super Metric|sm_<ID of one above>, depth=1})

I tried to make a single supermetric but the system I was using wasn’t having any of it.

So now our OrgVDC object has the following supermetrics. This is a fleshed out model.

VDC Label NameVDC ValuevROps MetricvROps Value
CPU Allocation Used688.50 GHzCPU|Used (GHz)688.5
CPU QuotaUnlimitedSM – Parent CPU Total<756>
CPU Resources Guaranteed90%SM – Child VM CPU Reservations<See Below>
vCPU Speed2.55 GHzCPU|vCPU Speed (GHz)2.55
Memory Allocation Used2,269.00 GBMemory|Used (GB)2,269
Memory QuotaUnlimitedSM – Parent Mem Total<10,240>
Mem Resources Guaranteed90%SM – Child VM Mem Reservations<7.3>
Max number of VMsUnlimitedGeneral|Max Number of VMs0
VCD-2-vROps Reservation Pool with SuperMetrics

Ah, yeah, vCPU reservations on VMs. Do you remember way back I mentioned that you can use a different vCPU speed to the actual processor. Well, it’s time for that to make a guest appearance.

When VCD is setting the limit on the VM it’s taking that vCPU speed and mulitplying it via the number of vCPUs in the VM and using that value as the CPU limit.

2 vCPU machine on my 2.55Ghz vCPU speed VM is a limit of 4.6Ghz. BUT when a VM is started up the CPU speed is determined by the actual processor speed in the physical host, in my example earlier 3Ghz, so the total capacity of the VM vCPU is actually 2 vCPU * 3Ghz = 6GHz total capacity, so the VM has:

Total Capacity as determined by vSphere6Ghz
Total Capacity as intended by VCD4.6Ghz
Limit as set by VCD at 100% and enforced by vSphere4.6Ghz
Reservation as set by VCD at 90% and enforced by vSphere4.14Ghz
VCD Intention vs vSphere Reality

Notice that the Limit and the Total Capacity are very different. That will appear as Contention in vROps if the VM is under load. Better make sure your capacity planning processes are up to speed.

One thing to be conscious of is the values that are being used. VCD works in MB and GB, Mhz and GHz. vROps typically works in MB and MHz. There’s no way to resize the units with supermetrics (EDIT: vROps 8.1 can adjust units in SuperMetrics but as of this blog post I’ve not tested it).

So why do all this?

Monitoring. Performance and Capacity. At the most basic level it’s very hard to determine the Total Capacity vs Allocated vs Demand vs Reservation vs Guarantee across VCD OrgVDCs. The metrics don’t line up. VCD is about intentions but the enforcement is done by vSphere and as the vCPU Speed example shows, Intention and Reality don’t always work seamlessly and you need that operational intelligence to understand whats actually going on; what are the VMs that deliver your services to your customers actually doing.

So all that said, what did this eventually lead to?

With some VMware PSO magic, a trend line on a graph.

vRealize Operations Continuous Availability

As Grandfather Nurgle blesses Terra with his latest gift I decided to have a little play with vRealize Operations 8.0 and Continuous Availability (CA).

CA (for I’m not writing continuous availability all the time) is the enhancement for vROps HA that introduces fault domains. Basically HA across two zones with a witness on a third location to provide quorum.

I’m not going into the detail about setting CA up (slide a box, add a data node and a witness node). Lets look at three things that I’ve been asked about CA.

Question 1; Can I perform a rolling upgrade between the two fault domains ensuring that my vROps installation is always monitoring?

No. The upgrade procedure appears to be the same, both FDs need to be online and accessible and they both get restarted during the upgrade. There’s no monitoring.

I hope that in a coming version this functionality appears (and I’ve no insight, no roadmap visibility) because we’ve asked a few times over the years.

Question 2; How does it work in reality?

Aha. Finally, take that marketing. A free thinking drone from sector sieben-gruben.

Lets build it and find out. So I did.

The environment is a very small deployment:

2 Clusters, consisting of a VC 6.7, a single host (ESXi 6.7)

  • vROps 8.0 was deployed using a Very Small deployment to the two clusters, a node in each.
  • The witness node was deployed externally as a workstation VM.
  • The entire thing is running in under 45GB of RAM and on a SATA disk (yeah SATA!)
  • CA was then enabled and upgraded to 8.0.1 Hotfix (which answered Q1).

Which looks like this:

The node called Latency-2 (dull story, just go with it!) is the master node, so lets rip the shoes of that bad boy and watch what happens…

Straight away the admin console started to spin it’s wheels

Then it came back and the Master node is now Inaccessible with the CA ‘Enabled, degraded’

It’s 2.50mins and the UI as a normal user is usable, slow, with a few warnings occasionally, but usable. The Analytics service is restarting on the Replica node.

An admin screen refresh later and the Replica is now the Master and the analytical service is restarted. The UI is running. Total time, 5.34min.

Not too shabby.

Note that the FD2 is showing as online but the single member node is offline.

I wonder if the ‘offline’ node knows it’s been demoted to Replica?

A quick check of the db.script reveals that it’s actually offline with a ‘split_brain’ message and it appears to be ready to rejoin with a role of ‘Null;.

Lets put it’s shoes back on and see what happens:

The missing node is back and as the replica, albeit offline. The UI isn’t usable and is giving platform services errors.

At this point I broke it completely and I had to force the cluster offline and bring it back online. However, I’ve done this CA failover operation a few times and it’s worked absolutely fine so whilst I’m pleased it broke this time, for me it highlights how fragile CA is.

Anyway, it didn’t come back online. It was stuck waiting on analytics. Usually this means a GSS call.

Service Monitoring

2020.

New year, new decade. Same old story; I’m sitting in a virtual meeting room, listening, as two tribes go to war.

In the blue corner; the infrastructure peeps, opposing them, across the corporate battle field, in the red corner; the call centre soldiers. Lines draw, they rush forward. War cries fill the air.

The strategic goal was to expand their respective empires. The tactical objective to decide who sets the thresholds for monitoring.

There was a voice missing. Probably the most critical voice. The true owner; the service owner.

Businesses exist to make money. I know I know. Bizarre. They employ people to work out how to make money. These people identify market opportunities and develop strategic plans to exploit that opportunity. The solution will eventually be offered to the market via a route. That whole package, a service, will have an owner who is responsible for it. The service owner will have metrics or performance indicators that will provide insight into the performance of the service. This might be as simple as number of sales, growth of sales over a period of time.

Part of the service, for an IT organisation, will also include things like availability, response times, number of users (different to number of sales), error counts. Various metrics. These are set in a number of ways. From the business, the market, standards, regulations, vendors, best practices. Not the service desk, not the IT team.

The IT organisation of the business is responsible for the running of the IT infrastructure. They also have various performance indicators help them manage the IT infrastructure, but ultimately it has to meet the requirements of the business and support the services of the business.

This means matching the capabilities of the IT infrastructure to the requirements of the various service owners.

So watching two IT organisation teams battle it out for control of who sets the thresholds for the IT infrastructure is missing the point. The thresholds will be be set ultimately by the service owner.

Of course, they can quite happily set lower thresholds, below what the service requires. But alas, this was a compromise too far.

And the meeting. No victor was crowned that day. Their forces will line up again to do battle again at another time and place.

Grab the popcorn. This has more sequels than Star Wars.