Nine months. It’s been nine months since the last post. What have I been doing? Well, lots of things:
- Got a published whitepaper (which I can’t blog about because it’s paid content)
- Recorded a change management video (which I can’t blog about because it’s paid content)
- Conducted basic and advanced training (which I can’t blog about because it’s paid content)
- Handled various escalations (which I can’t blog about because…seriously you’re asking…)
Then the batphone rang. Someone has identified that there are a series of alerts from NSX-T which are present in NSX-T manager but are not appearing in vRealize Operations, and therefore this is causing them operational problems within their ITSM.
Now this looks like a job for me
So everybody, just follow me
'Cause we need a little controversy
'Cause it feels so empty without me
Eminem – Without Me
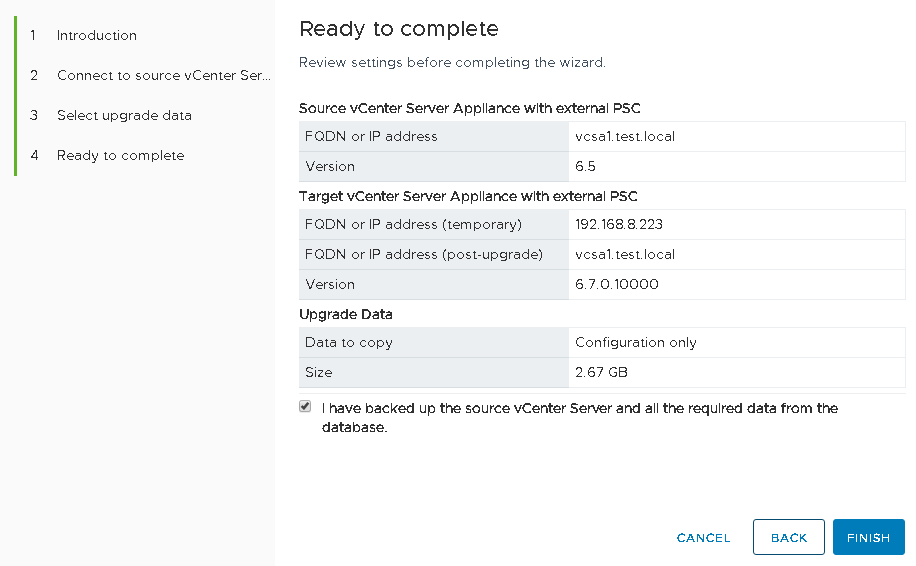
With nary a nod to self-preservation I jumped straight in and gathered the available tools, vROps 8.1, vRLI 8.1 and NSX-T 3.0.
- Job 1: Can we see the alerts in NSX-T (yes we can)
- Job 3: Can vRLI see the alerts via the log events (yes it can)
- Job 3: Can we see the alerts in vROps (nope)
Success. As long as vRLI can see the events in the log files then we can raise an alert to vROps.
Excellent, I’m 10 minutes in and I’ve already solved this problem. Ah, nope. vRLI will raise the alert to vROps and it will correctly assign it to the vROps element. This doesn’t account for physical devices (physical edge nodes), actual NSX-T services (vROps has the concept of Edge Node or management node), and this all could be inconsistent which then breaks the customers ITSM.
It was at this time, I realized we have an interesting problem to solve; It’s not about getting the info or seeing the alert, it’s about making a consistent process that an unrelated 3rd party product can handle, without being overly complex.
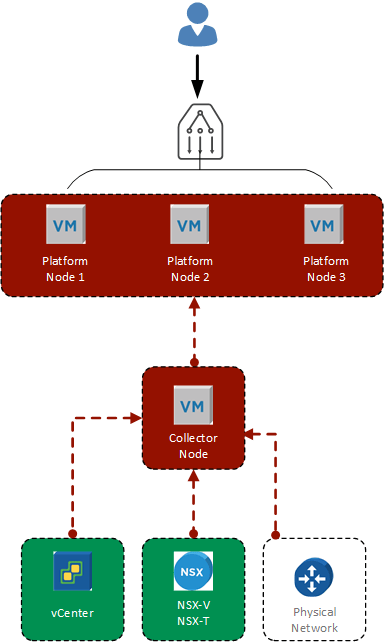
Lets dig into the three components I can influence and see what we need from each of them.
NSX-T
This one is fairly straight forward. We need to ensure that the log files from NSX-T are being sent to Log Insight. If you’re still using NSX-V(sphere) and using scripts then NSX-T is much easier.
Log into NSX-T Manager | System | Fabric | Profiles | Node Profiles

Now you just have to choose to use either syslog or the inbuilt Log Insight agent. Beyond some additional agent based magic fields there’s not much between the two options. I figured all this out using syslog but personally I would look to use Log Insight agents if I had the choice. Not because it offers better logs but it offers more possibility for future expansion and options.
The log level I selected was Information, because some of the alerts that the customer wanted are classified as Information, rather than warning or above. Again this can be to your own requirements but generally it’s Information by default IME.
After this I jabbed an NSX-T expert to generate some messages so I had some test messages to begin working on.
vRealize Log Insight
Events are being sent into Log Insight so next up was to make sure that I’m detecting the right events. There are quite a few ways I could configure this but I chose to make this very straight-forward for the customer; I created a simple query based upon multiple text filters.
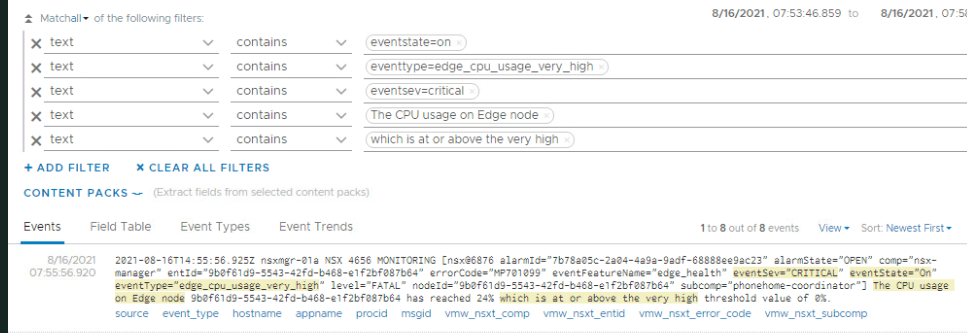
For example, the alert ‘Edge CPU Usage Very High’, configured to trigger for testing:

I chose to make a number of text filters as it’s very easy to understand and maintain:
This query can then be saved. At this point you might be thinking how did I know the actual message NSX-T would send and the simple answer is it’s documented here by VMware, although it’s not 100% accurate.
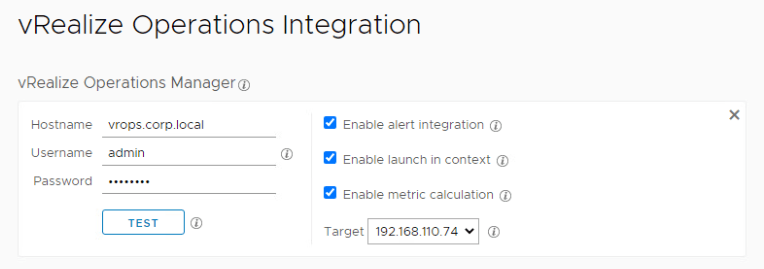
The next step is to determine how vRLI will send the alert onto vROps. This is two parts. The first is to ensure that vRLI is linked to vROPS. If you’ve got both vROps and vRLI you should have them linked and I’m not going to show how to do this but at a minimum ‘Enable Alert Integration’.
So far this has all been fairly basic stuff. Setup logging and a few queries. Now we come to the first tricky part: How does Log Insight send an alert to vROps and how does vROps know which object to assign the alert to?
Look at this event:

See that little blue ‘source’. That’s a magic field and source is who sent the event to Log Insight. In this case it’s nsxmgr-01a.corp.local. There is also ‘hostname’, which often matches source.

This info is passed over to vROps and the event is assign to the object with this name. This is part of the problem. The customer process doesn’t want the alert to be raised against the NSX manager if the problem is with a NSX-T service. In this example it’s marginally important but in an customer that spans countries, having a problem with a Tier0 gateway and getting the alert assigned to a Edge node, whilst your ITSM is looking for the Tier0 gateway problem is not helpful.
Do you see another problem?
This event extract is reporting a CPU problem on Edge node 9b0f61d9-5543-b468-e1f2bf087b64, which is nice. Imagine Roberta. Nice lass. Works on the helpdesk nightshift. Is Roberta going to know what that ID is? Does that tell her who to call out? How serious is it that 9b0f61d9 has gone wrong? Yes the answer is in NSX-T but helpdesk probably isn’t going to have access to the NSX-T management console. Still, keeps me in a job and that’s a problem for another day.
Anyway I digress. Lets take a look at setting up my query as an alert and sending it to vROps:
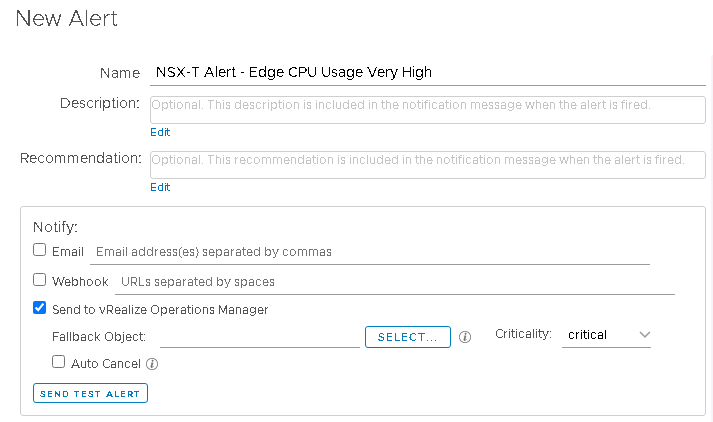
Looks like we need a fallback object. A fallback object is a default object within vROps that an alert can be allocated to if vROps doesn’t identify the passed object to assign the alert to. This is important if you’ve got something like a physical edge device, which vROps will not have any concept of because vROps isn’t monitoring physical devices.
So lets pause vRLI at this point, because we need a fallback object and that’s done in vROps.
vRealize Operations
And so we arrive to vROps. We need to create a fallback object. The easiest way is to create a Custom Group and then configure it in such a way that it doesn’t actually have any vROps object inside it.
After a cup of coffee and a cheeky biscuit (chocolate hobnob no less!) I created two new custom group types (vROps | Administration | Configuration | Group Types).

The custom group will be of the type NSX-T Fallback Objects and it will be a static group consisting of NSX-T Fallback Members.
What’s a NSX-T Fallback Member? Nothing. A placeholder that should never exist. Perfect for populating empty groups.
Now we can create the custom group.
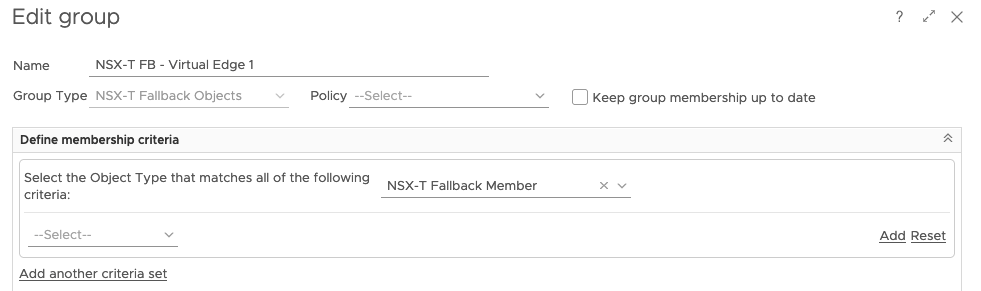
Notice that it’s of the custom group type NSX-T Fallback Objects, it’s a static group (keep group membership up to date is not checked) and it’s looking for NSX-T Fallback Members, which should never exist. Excellent. A custom group that will never be populated but is a perfectly formed object.
Back to..
vRealize Log Insight
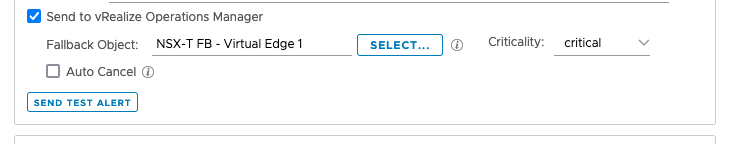
We left this sat waiting for us to fill in the Fallback object.
Click on ‘Select’ and change the drop down to ‘All Objects’ and then just search for and select the Fallback Object we just created in vROps

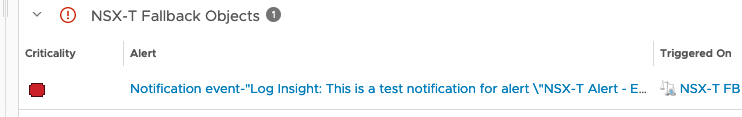
Sending a Test Alert will appear against the Fallback object so you can use this to see if it works. This can take 5 minutes to appear in the Alerts window in vROps.

Hammering it multiple times will cause vROps to group the test alerts together so you get multiple symptoms for a single vROps alert.
Excellent, job jobbed. We can pickup the alerts from the NSX-T logs inside vRLI. Then use vRLI to send them on as alerts into vROps with them assigned to either the source of the event or a Fallback object.
Well not quite. This isn’t scalable and the single Fallback object will mask which object we actually need to assign the alert to. And it needs to be consistent and some alerts to virtual edges and some alerts to a fallback isn’t consistent (or consistently wrong depending on your POV).
It’s time to get creative and review the basics.
vROps creates objects based upon what it ‘sees’. vROps ‘sees’ the vSphere world via the vCenter and most logs will be attached to the vCenter VM objects (because from vRLI’s POV it’s a virtual machine that sent the alert, not a service). So vRLI alerts will be raised against a VM or the Fallback object.
What if we removed the permission of the vROps service account to see the NSX-T VM? Well, vROps doesn’t create an object for that NSX-T VM which means when vRLI passes it an alert it’s going to have to assign it to the Fallback object.
What if we created a Fallback object for every NSX-T device we need to alert against? Then we’re raising vRLI NSX-T alerts against specific Fallback device based upon the vRLI alert query. If we added a ‘hostname’ filter then we can assign specific Fallback objects for individual alerts.
Now that’s all good and proper, but that’s massive manual operations. Nobody wants to be doing this (or nobody should be doing this).
Therefore we need a workflow. Something like:

Amazing.
Can we code and therefore automate this? Yes we can. Both vRLI and vROps have REST APIs which can do this. vCenter has an SDK which can manipulate permissions on objects. I’m not going to look at the vCenter code; vCenter 7 has Code Capture and you can just enable this, record yourself editing the permissions on a VM and then review the code output in several languages (Powershell, Python, Javascript etc).
Code, Scripting, face-planting on the keyboard
vRealize Operations
To begin with lets look at the vROps code and I’m going to make the following assumption:
- The object has already been removed (if it existed) from vROps
First we need to setup our REST API headers
vRealize Operations Headers
| Content-Type | application/json |
| Accept | application/json |
Once the token has been created we will add:
| Authorization | vRealizeOpsToken <TOKEN> |
Generating a vRealize Operations login token
| Method | POST |
| URL | https://<vrops-fqdn>/suite-api/api/auth/token/acquire |
| Body | { “username” : “<username>”, “password” : “<password>” } |
This generates a response, with the token highlighted:
{“token”:”c60b962c-1b1b-4a48-b1d1-14412eb08402::37b247b1-02b2-4e5a-87d5-6936c99aea9c“,”validity”:1628700487274,”expiresAt”:”Wednesday, August 11, 2021 4:48:07 PM UTC”,”roles”:[]}
Therefore the Authorization header looks like this (and remember to remove the body with the username / password):
| Authorization | vRealizeOpsToken c60b962c-1b1b-4a48-b1d1-14412eb08402::37b247b1-02b2-4e5a-87d5-6936c99aea9c |
Now we can create the static group type.
Creating a Static Group Type
The custom group type enables all NSX-T fallbacks objects to share an object type. This provides opportunities for data manipulate later. Both commands only need to be run once per vRealize Operations installation.
| Method | POST |
| URL | https://<vrops-fqdn>/suite-api/api/resources/groups/types |
| Body | { “name” : “NSX-T Fallback Objects”, “others” : [ ], “otherAttributes” : { } } |
This call creates a second custom group type. This enables the population of the custom groups with empty, static memberships.
| Method | POST |
| URL | https://<vrops-fqdn>/suite-api/api/resources/groups/types |
| Body | { “name” : “NSX-T Fallback Member”, “others” : [ ], “otherAttributes” : { } } |
If an attempt to create the group is performed and it already exists then a response code 500 is generated which means the object already exists.
Creating a Custom Group
The custom group is an object that can be built to have either a dynamic or static membership. These objects can have no members but are suitable for an alert to be raised against it.
The following extract builds a custom group with a static membership based upon the custom group type created in the previous code extract.
In this extract the “name” would need to be amended as required.
| Method | POST |
| URL | https://<vrops-fqdn>/suite-api/api/resources/groups |
| Body | { “resourceKey” : { “name” : “NSX-T FB – Virtual Edge 1”, “adapterKindKey” : “Container”, “resourceKindKey” : “NSX-T Fallback Objects”, “others” : [ ], “otherAttributes” : { } }, “autoResolveMembership” : false, “membershipDefinition” : { “includedResources” : [ ], “excludedResources” : [ ], “custom-group-properties” : [ ], “rules” : [ { “resourceKindKey”: { “resourceKind”: “NSX-T Fallback Member”, “adapterKind”: “Container” }, “statConditionRules” : [ ], “propertyConditionRules” : [ ], “resourceNameConditionRules” : [ ], “relationshipConditionRules” : [ ], “others” : [ ], “otherAttributes” : { } } ], “others” : [ ], “otherAttributes” : { } }, “others” : [ ], “otherAttributes” : { } } |
If we try to create the group and it already exists then a response code 500 is generated, which means the object already exists.
So we’ve now got REST API code extracts for creating the two vROps group types and we’ve created a group also using the REST API. Time for another shot of caffeine.
vRealize Log Insight
Ok I had another hobnob as well.
As before we need to setup our REST API headers
vRealize Log Insight Headers
| Content-Type | application/json |
| Accept | application/json |
Once the token has been created we will add:
| Authorization | Bearer <TOKEN> |
Generating a vRealize Log Insight login token
| Method | POST |
| URL | https://<vrli-fqdn>/api/v1/sessions |
| Body | { “username” : “<username>”, “password” : “<password>” } |
This generates a response, with the token highlighted:
{“userId”:”45fd3625-b9b5-4ef4-8f4c-1022e82d20dd”,”sessionId”:”Hom8ZlThpPTLZa79cCJmHsMVqbx0Dvopmi35wvVBQneP+1yvhI+aUmL7Hw6bdGo02pK/MKDtRuf3CeYum7qs/hIYpzQtKOhxjVd2cjW24/TINEYQhJ0ebYp4fD4oajmQ+n28d1iwdPGxP+k+gzLwCDA/nm7B80Vge/QP6v8DrW0KUH5Jn15COjKikMC/9kt56gx20NWpHcLM6Hjxt0CHI4VDY2AWy18hDkHjZbs27Wr2vcwjkb6MnpDI4M9Y9KV6xo0Wk71Kqeo4YwEZKMHYxA==“,”ttl”:1800}
As before cleanup the body and add the Authorization header.
Alert Creation
When creating the alerts the following is the general format and the body section is detailed below.
| Method | POST |
| URL | https://<vrli-fqdn>/api/v1/alerts |
| Body | { “name”: “NSX-T Alert – Edge CPU Usage Very High”, “info”: “”, “recommendation”: “”, “enabled”: true, “vcopsEnabled”: true, “vcopsResourceName”: “NSX-T FB – Virtual Edge 1”, “vcopsResourceKindKey”: “resourceName=NSX-T FB – Virtual Edge 1&adapterKindKey=Container&resourceKindKey=NSX-T Fallback Objects”, “vcopsCriticality”: “critical”, “alertType”: “RATE_BASED”, “hitCount”: 0.0, “hitOperator”: “GREATER_THAN”, “searchPeriod”: 300000, “searchInterval”: 300000, “autoClearAlertAfterTimeout”: false, “autoClearAlertsTimeoutMinutes”: 15, “chartQuery”: “{\”query\”:\”\”,\”startTimeMillis\”:1625842439130,\”endTimeMillis\”:1628600280387,\”piqlFunctionGroups\”:[{\”functions\”:[{\”label\”:\”Count\”,\”value\”:\”COUNT\”,\”requiresField\”:false,\”numericOnly\”:false}],\”field\”:null}],\”dateFilterPreset\”:\”CUSTOM\”,\”shouldGroupByTime\”:true,\”includeAllContentPackFields\”:false,\”eventSortOrder\”:\”DESC\”,\”summarySortOrder\”:\”DESC\”,\”compareQueryOrderBy\”:\”TREND\”,\”compareQuerySortOrder\”:\”DESC\”,\”compareQueryOptions\”:null,\”messageViewType\”:\”EVENTS\”,\”constraintToggle\”:\”ALL\”,\”piqlFunction\”:{\”label\”:\”Count\”,\”value\”:\”COUNT\”,\”requiresField\”:false,\”numericOnly\”:false},\”piqlFunctionField\”:null,\“fieldConstraints\”:[{\”internalName\”:\”text\”,\”operator\”:\”CONTAINS\”,\”value\”:\”eventState=On\”},{\”internalName\”:\”text\”,\”operator\”:\”CONTAINS\”,\”value\”:\”eventType=edge_cpu_usage_very_high \”},{\”internalName\”:\”text\”,\”operator\”:\”CONTAINS\”,\”value\”:\”eventSev=critical\”},{\”internalName\”:\”text\”,\”operator\”:\”CONTAINS\”,\”value\”:\”eventFeatureName=edge_health\”},{\”internalName\”:\”text\”,\”operator\”:\”CONTAINS\”,\”value\”:\”The CPU usage on Edge node\”},{\”internalName\”:\”text\”,\”operator\”:\”CONTAINS\”,\”value\”:\”which is at or above the very high\”}],\”supplementalConstraints\”:[],\”groupByFields\”:[],\”contentPacksToIncludeFields\”:[{\”name\”:\”VMware – NSX-T\”,\”namespace\”:\”com.vmware.nsxt\”}],\”extractedFields\”:[]}” } |
Wow. Is that formatted? Yes. That’s what it needs to be. That final line starting “chartQuery” is all one line, and all the actual magic happens inside that line.
The code highlighted in blue are the constraints (the text filters) used to define the query and you can see the several text filters that I’ve used to ensure an accurate identifier.
NOTE: These filters are not looking for a specific Source or Hostname so it’s a more generic alert. I’ll leave it up to the reader to adjust this as required.
The code highlighted in green shows that I’m not looking for these filters in all the content packs, only the NSX-T content pack.
In Summary
The customer was having a problem with NSX-T alerts appearing in vROps in a fashion that was incompatible with their downstream ITSM software. This exercise was theoretical to see if we could get something working within their environment or if they would need a different solution. As you can see we have managed to get the alerts from NSX-T to vROps via VRLI, all using Out Of The Box (OOTB) functionality and assigned consistently to a specific fallback object (again OOTB), which can then be picked up via their ITSM integration (with some minor adjustment on their side). We then enhanced this theoretical solution by ensuring that it can all be coded and automated so no poor soul has to do this manually and fits into their everything as code methodology.
And we had fun. My wife just asked if we have any chocolate hobnobs left, we do not.


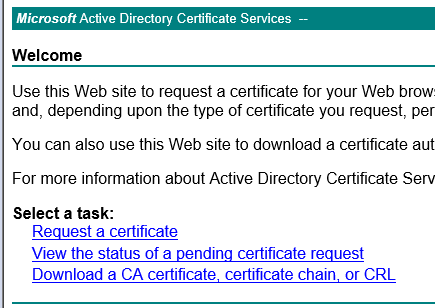
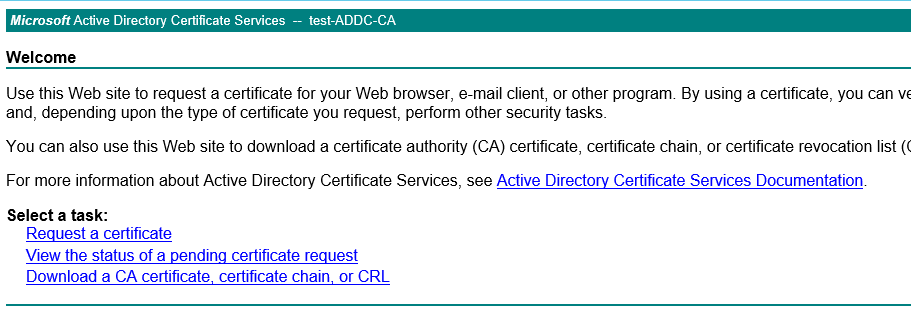 Click on Download a CA certificate