The writers strike edition – Upgrading from vSphere 6.5 to 6.7

I guess it’s time for a totally derivative episode.

Today, on filler episodes, it’s upgrading from vSphere 6.5 to vSphere 6.7.

Woo.

Background

This was done in my lab. I needed to upgrade it. The PSC has already been done, so this will show VCSA1 being updated.

Load the UI interface from the vCentre 7 ISO

1 - iso menu

Click on Upgrade

So you may not be aware (I mean it’s not like there’s more important things going on) but VMware are currently moving most of the products away from the underlying Linux base to a Photon base. This has a number of advantages, but one of the most visual (apart from the natty Photon boot screen) is that upgrades now consist of deploying a new appliance, migrating data from the old to the new, and then shutting down the new. This is annoying for poor people like me who have limited resources, but, it does mean I have a complete fall-back: just boot the old appliance;

2 - Failout options

Anyway, onwards.

3 - wizard1

Ta-da, it’s a wizard, you know the deal: next, next, next, finish….

I’m not going to screenshot every screen, because:

4 - wizard2

Click Connect to Source to move forward. Ha, no Next box…

Next you need to provide some additional info.

5 - wizard3

Note: Here I’ve used an IP address for my ESXi host. This is partly because of my lab setup, and partly because I find vCentre deployments (and this is basically a deployment and file copy) work better when I point directly to the host I want to deploy to.

6 - wizard4

Give the VM a unique name. I’m a fan of self-documenting things.

7 - wizard5

Pick a size

8 - wizard6

Select a datastore

I’m sticking it on a datastore called _vRA because it’s got space, and once everything’s working I’ll move it to a SSD

9 - wizard7

Give it temporary IP settings

A few things here, the temporary IP address must be free. It doesn’t need a DNS entry.

10 - wizard8

The IP address is used during the upgrade but is released after the upgrade is complete. When doing my PSC I used .222:

11 - wizard9

And with no reboots or anything on my end, it’s nice and free.

And finally, Finish

12 - wizard10

And it so it begins

13 - deploy

14 - deploy2

Around this point, it boots the new VM

14 - deploy2

15 - deploy3

Waits for a long time and then deploys the settings configured during the wizard

16 - deploy4

Stops and starts various services and then the new appliance is online

17 - deploy5

18 - deploy6

Stage 1 complete.

19 - deploy7

Stage 2 begins

20 - upgrade1

Gah. Why is nothing ever easy.

21 - upgrade2

Seems ok

22 - upgrade3

Reboot and it worked.

23 - upgrade4

Oooh, more problems…

24 - upgrade5

25 - upgrade6

26 - upgrade7

Remove the 5.5 host I had lying around, and onwards dear fellow, onwards.

27 - upgrade8

I only want my lab configuration.

28 - upgrade9

And go go go

29 - migrate1

30 - migrate2

31 - migrate3

I know it’s a lab, but this isn’t quick

32 - migrate4

At some point it’s swapped my VC’s over

33 - migrate5

And finally

34 - migrate6

The PSC was roughly the same process. Took about 90 minutes for both the PSC and VC.

vRealize Operations and Certificates

So it seems this has been sat unpublished for a while. My bad… I’m really just faking this whole tech thing!

Recently (well not see above) I was asked to help generate some certificates for vROps. The customer was having some problems and just wanted an easy step by step example.

This is all done in my lab, so the basic setup is:

  • 1 * AD server with a Certificate Authority installed, with a custom template built for generating VMware compatible certificates.
  • 1 * vROps Analytical Node
  • 1 * vROps Remote Collector

So, onwards my dear fellow:

Download the root CA certificate

01 - ADCA-FrontPageClick on Download a CA certificate

02 - ADCA-RootCADL

Select Base 64 and then Download CA certificate

I called it ‘ca.cer’

Once downloaded I opened it in Notepad++ just to see what it downloaded:

03 - ADCA-RootCAEX

Lovely.

Then I opened an SSH session to the vROps master node.

I use the master node and the local openssl to avoid any problems. You can use an external openssl if you want.

Checked the openssl directory ‘openssl version -d’

04 - VR-CLI

And the version itself ‘openssl version’

05 - VR-CLI

Made a folder to store my certs in mkdir /tmp/cert

06 - VR-CLI

Created a vrops.cfg file to store my certificate CSR details in

07 - VR-CLI08 - VR-Details


distinguished_name = req_distinguished_name

encrypt_key = no

prompt = no

string_mask = nombstr

req_extensions = v3_req

[ v3_req ]

basicConstraints = CA:FALSE

keyUsage = digitalSignature, keyEncipherment, dataEncipherment

extendedKeyUsage = serverAuth, clientAuth

subjectAltName = DNS:vrops.test.local, IP:192.168.8.12, DNS:vrops, DNS:vrops-rc1.test.local, IP:192.168.8.23,DNS:vrops-rc1

[ req_distinguished_name ]

countryName = XX

stateOrProvinceName = XXXXXX

localityName = XXXXXX

0.organizationName = XXXXX

commonName = vrops.test.local


If your using  a Load Balancer, then the commonName should be the name of the load-balancer. The SAN should also have the load-balancer details.

Once this is written it’s time to generate the private key:09 - VR-GenKey

And the good stuff:

09 - VR-GenKeyEx

Now generate the actual CSR:10 - VR-GenCSR

And the output file ‘vrops.csr’ looks like:11 - VR-GenCSREx

Take the CSR and switch over to the CA server.

12 - ADDC-SubmitCSR

Click on Request a certificate:

13 - ADDC-SubmitCSR

Select ‘advanced certificate request’

14 - ADDC-SubmitCSR

Select ‘submit a certficate request by using….’

15 - ADDC-SubmitCSR

Copy the text from the .CSR file, including the header and tail and paste it into the box:

16 - ADDC-SubmitCSR

Pressed Submit

17 - ADDC-DownloadCert

Select Base 64 encoded and then download the the certificate. I called mine ‘vrops.cer’. Opening it in Notepad it looks like this:

18 - ADDC-DownloadCertEx

So, I have:

19 - ADDC-DownloadCerts

Upload these to the vROps Analytical node. I upload them to the same node I used to generate the .csr as it already has the .key file. I use WinScp and place the new files into the same folder.

20 - VR-Upload

21 - VR-Upload

Time to make the PEM file. The order is:

vrops.cer This was just generated from the Root CA above
vrops.key This was generated earlier and is the private key
Chain.cer This is where any intermediatery CA is placed. There isn’t one in my lab, so it’s not present
ca.cer This is the final ROOT CA certificate

Chain them together into a single file called the vrops.pem

22 - VR-BuildChain

Taking a look at the PEM file (this is a single file, but the screenshot is split into two):

23 - VR-ChainEx24 - VR-ChainEx

And with this we should have a working, valid vROps certificate.

I can check this by switching to a Windows machine and opening MMC / Certificates and importing the certificate into my personal store. This will allow me to browse the certificate to check the info.

Switch to vROps admin page log in and in the top right there will be a certificate icon:

25 - VR-ApplyCert

This will load a window showing the current certificate, click on Install New Certificate:

26 - VR-ApplyCert

Click on Browse and select the PEM file. vROps will check the PEM file to ensure it’s valid:

27 - VR-ApplyCert

Click on Install and after a few minutes this occurs:

The Master Node

29 - VR-MasterDone

The Remote Collector via IP

30 - VR-RCDone

But what if the PEM file isn’t accurate:

31 - VR-BadEx

It gives the red-exclamation mark and won’t let you proceed

If you check the admin-ui.log file you might get a hint as to what’s wrong:

32 - VR-BadEx

This shows that it was CASA that through the error, which makes sense, so checking the casa.log file:

33 - VR-BadEx

So in this example my private key doesn’t work with the generated .csr output. Which is correct as I swapped my valid .csr output out with one that was configured for a load-balancer, so it wasn’t valid.

Other scenarios I’ve come across is ‘incomplete chain’. This usually means that the root CA and the intermediate CA’s are in the wrong order or, if you’ve got a complicated environment, simply the wrong .cer files.

What’s my exposure to Meltdown and Spectre

**UPDATE**

VMware have released a vRealize Operations pack, which you can read about and download from here.

It’s entirely possible that this pack features an updated version of this dashboard 😉

****

Saunter in the office, after the New Year break, ready for the challenges that 2018 will bring. The coffee is barely out of the pot when Intel drops a late crimbo present…

It’s in the mainstream media and the directors are panicking “What’s my exposure?”

Well let’s ask vRealize Operations.

So this blog post will concentrate on my VMware lab, and images are obviously edited to remove details, but the principles work.

There are four areas that are immediately exposed to me via vRealize Operations that I can use to see where I’m carrying a risk:

  • Physical Server BIOS
  • VMware vCenter
  • VMware ESXi
  • VMware VM hardware level

I want a pie-chart for a quick visualisation and ideally a list of objects that need patching.

Create a new dashboard:

meltdown.1-new

Then I shall use the View widget (enabling information to be presented in both a pie-chart and a list) and layout my dashboard:

meltdown.2-layout

To create the first view, edit the widget providing:

  • Title
  • Self-Provider : On
  • Object : vSphere Hosts and Clusters, vSphere World

meltdown.4-biospie

Create a view with the following settings:

  • Name = Some easily identifiable unique name
  • Description = Something relevant
  • Presentation = Distribution
  • Visualisation = Pie Chart
  • Subject = Host System
  • Data = Host System, Properties

Add the following properties:

  • Hardware | Hardware Model

Provide a better metric label and optionally add a filter. I’ve not because my BIOS levels are for HPE and just show the BIOS family, so not entirely useful.

Hit Save and then Save again to load the view to the widget and voila, physical host BIOS versions.

Move to the next widget to the right and lets create a similar view that shows a list of the physical hosts. Edit the widget and provide:

  • A Title
  • Self-Provider : On
  • Object : vSphere Hosts and Clusters, vSphere World

Create a view with the following settings:

  • Name = Some easily identifiable unique name
  • Description = Something relevant
  • Presentation = List
  • Subject = Host System
  • Data = Host System, Properties

Add the following properties:

  • Hardware | Hardware Model
  • Hardware | BIOS Version
  • Runtime | Power State

Hit Save and then Save again to load the view to the widget and voila a list of the  physical host models, BIOS versions and power state.

meltdown.6-biosx2

Ahh, vROps, fifty shades of blue. Horrendous.

Anyway moving onwards, similar process again for vCenter Build numbers, ESXI Build numbers and VMware hardware level.

Something similar to:

meltdown.3-finallayout

Lets get a little more advanced: lets filter out my vCenters that are already patched to the appropriate level.

Lets jump over to VMware’s vCenter download page for vSphere 6.5, vSphere 6.0 and vSphere 5.5 and get the new patched build numbers.

Click on More Info to see the build number (6.5 shown)

meltdown.11-buildv

Back in vRealize Operations, edit the first vCenter widget and edit the view.

In the main Data view, switch to the Filter tab

Check the preview source to see that the Summary|Version property is the full version number, and that the final part is the build number

meltdown.7-vc

At the bottom of the screen add the following filter criteria:

  • Properties Summary|Version is not 6.5.0-7515524
  • Properties Summary|Version is not 6.0.0-7464194
  • Properties Summary|Version is not 5.5.0-7460842

meltdown.8-vcfilter

Save this amendment and now only the vCenters that are not at the appropriate patched levels will show.

NOTE: This will also also show vCenters that are above the filtered level

Repeat this process for the vCenter remediation list view widget:

meltdown.9-vcx2

Repeat until your sick of blue:

meltdown.10-db1meltdown.10-db2

** Download removed, because a newer version is included in the VMware pak, outlined above.


vRealize Operations to Splunk

vRealize Operations is a fantastic data analysis tool from VMware, but its ability to talk to other products has always been limited to a few options.

Recently I needed to make vROps forward on its alerts to the log analysis tool Splunk using a Splunk HTTP Event Collector (HEC). This means taking the REST output from vROps and forwarding it on to the HEC;

Blog - vrops2splunk-WebShim

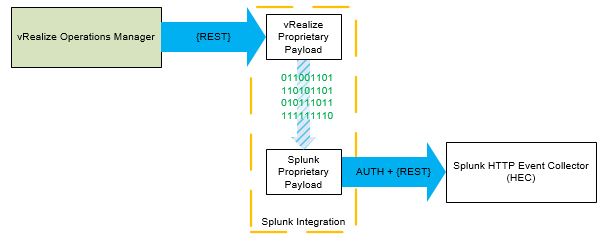
VMware call this a Web-Shim and the basic process is outlined in VMware’s John Dias excellent blog series. That blog series discusses using vRealize Orchestrator, so it was time to get learning Python.

I broke this into 4 stages:

  1. Generate a vROps output
  2. Capture the vROps output in a webshim
  3. Generate a Splunk input
  4. Use python to turn the vROps output into the Splunk input

I didn’t figure this out in this order, it’s just easier to read it in this order!

Stage 1 – Generate a vROps output

Lets start at the beginning. We want to send an alert to Splunk via the HEC. I could wait around for vROps to send some alerts, or I can build one I can trigger as required.

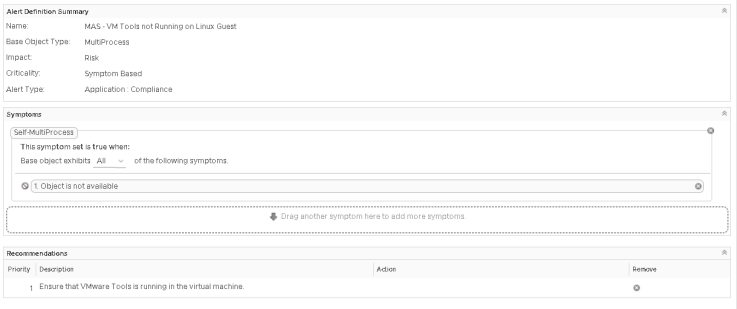
I like to have an alert that monitors the VMware tools service. I then stop and start the VMware Tools service as required which triggers an alert:

Blog - vrops2splunk-vropsalert

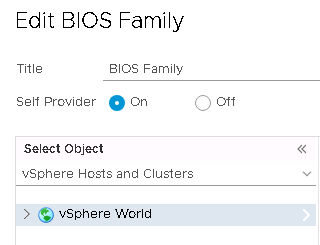
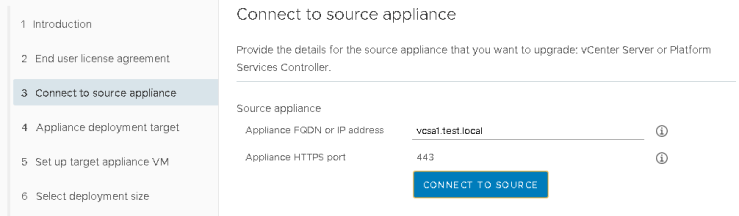
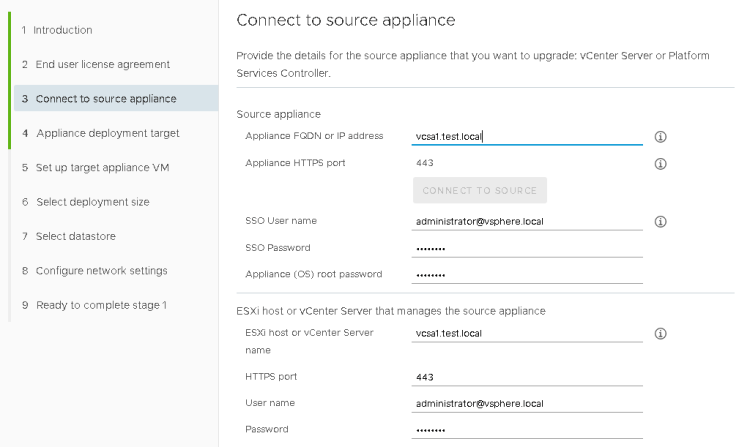
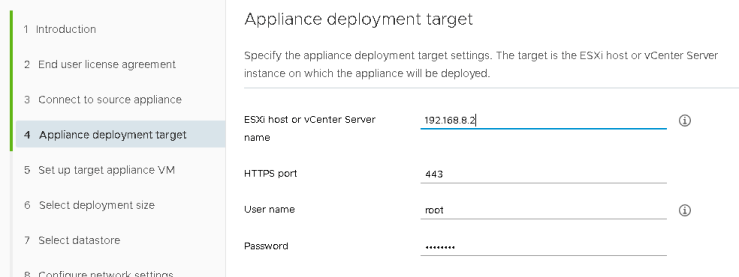
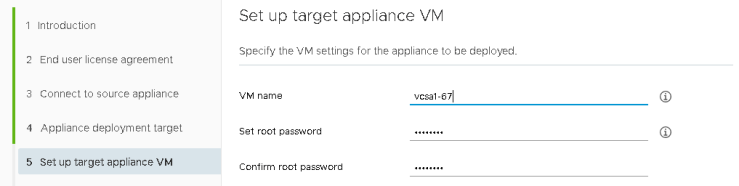
And now it’s time to configure vROps to send the alert notification. From inside vROps you will need to configure an outbound server:

vrops-shim-outbound

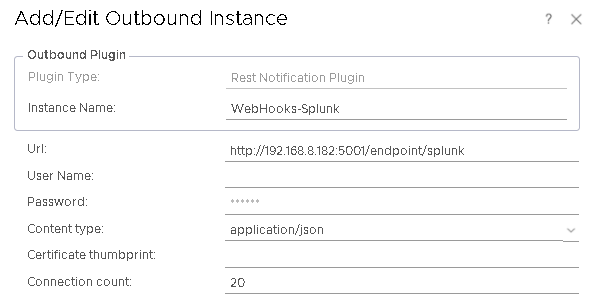
This is a fairly basic configuration, just ensure that the URL points to the name of the function in the Python code.

Configure a notification event. I used a notification that will send everything to Splunk:

vrops-shim-notification

Finally I have an EPOps alert that I can trigger on demand. I have added a simple recommendation to this alert:

vrops-shim-custom-alert

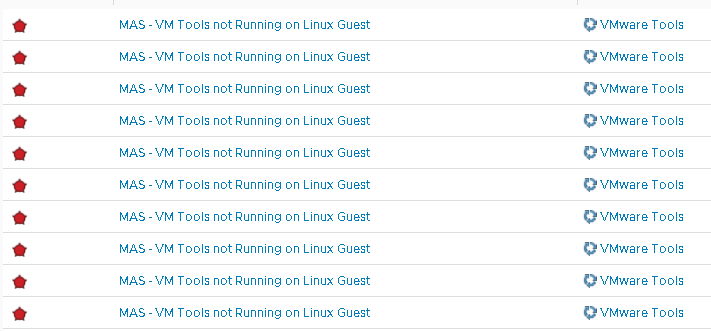
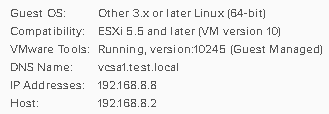
Now to generate this alert on demand, I go to my test box (vSphere Replication with VMware Tools and EndPoint Operations), start vRealize Operations EPOps agent, and then stop the VMware Tools service. This will trigger the alert, which will appear in my shim. Then just restart VMware Tools to cancel the alert.

This can be used multiple times to test the code:

vrops-flipping-tools

Stage 2 – Capture the vROps Output in a webshim

Having originally followed and copied John’s web series I already had a PhotonOS environment that could host the webshim code. Digging deeper in this example code I discovered that it was possible to reuse pieces of VMware’s code to capture and parse the vROps output.

NOTE: I did discover this after almost pretty much writing something vaguely similar and functional but VMware’s code was just better!

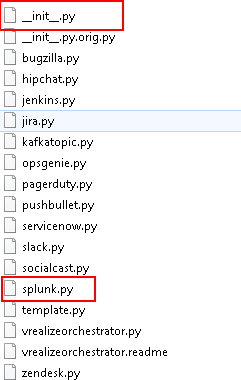
From the VMware code I took the basic folder layout and modified the following file:

  • __init__.py

This file has the various logic for parsing both LogInsight and vRealize Operations input, along with the sample webshims. I modified this file at the bottom where it imports the various webshim Python code:

# Import individual shims
#import loginsightwebhookdemo.bugzilla
#import loginsightwebhookdemo.hipchat
#import loginsightwebhookdemo.jenkins
#import loginsightwebhookdemo.jira
#import loginsightwebhookdemo.kafkatopic
#import loginsightwebhookdemo.opsgenie
#import loginsightwebhookdemo.pagerduty
#import loginsightwebhookdemo.pushbullet
#import loginsightwebhookdemo.servicenow
#import loginsightwebhookdemo.slack
#import loginsightwebhookdemo.socialcast
#import loginsightwebhookdemo.template
#import loginsightwebhookdemo.vrealizeorchestrator
#import loginsightwebhookdemo.zendesk

# Shim for Splunk...
import loginsightwebhookdemo.splunk

I commented out the other webshims and added the splunk webshim code.

Then I created the file splunk.py and placed it into the loginsightwebhookdemo folder:

file-layout

It’s time to start writing some Python code.

To enable use of the functions included in the __init__.py file, I added the following lines to the top of the splunk.py.

#!/usr/bin/env python
from loginsightwebhookdemo import app, parse
from flask import request

I then created the Splunk webshim entry point into the function:

@app.route("/endpoint/splunk", methods=['POST'])
@app.route("/endpoint/splunk/<ALERTID>", methods=['POST','PUT'])
def splunk(ALERTID=None):

Finally I call the parse function from __init__.py to take the incoming payload (request) and produce a Python dictionary (alert):

 alert = parse(request)

If you look at this parse function in __init__.py you can see that it outputs to the screen the information that it is passed:

logging.info("Parsed=%s" % alert)

Finally close the Python function block:

 return

This completes the necessary code basic Python code:

#!/usr/bin/env python

# These are integration functions written by VMware
from loginsightwebhookdemo import app, parse
from flash import request

# This is the splunk integration function
@app.route("/endpoint/splunk", methods=['POST'])
@app.route("/endpoint/splunk/<ALERTID>", methods=['POST','PUT'])
def splunk(ALERTID=None):
 # Retrieve fields in notification, using pre-written VMware function
 alert = parse(request)
 return

With everything now configured, I start the Flask webserver using:

python runserver.py 5001

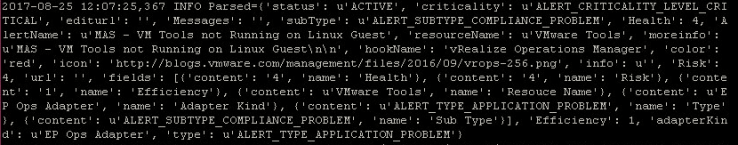
Once that’s running trigger the alert. The splunk code will be called with the vROps payload output to the screen:

vrops-parsed

Stage 3 – Generating a Splunk input

Splunk helpfully outline how to generate entries from the command line for the HEC:

curl -k -u "x:<token>" https://<host>:8088/services/collector -d '{"sourcetype": "mysourcetype", "event":"Hello, World!"}'

Let’s take a look at what this needs

  • -u “x:<token>”

This refers to the authorisation token, which needs to be created from Splunk

This refers to the HEC URL. Simply replace <host> with the FQDN of your HEC server.

  • -d ‘{“sourcetype”:”mysourcetype”,”event”:”hello world”}’

Putting this together will generate the ubiquitous Hello World message in Splunk:

Blog - vrops2splunk-cli

Excellent, now we need to programatically do the same.

What you don’t want to do is lots of trial and error, work out its the requests function within Python and then write a cheap, quick and dirty version of the callapi function in __init__.py. What you want to do is just use the callapi function in __init__.py that VMware provide. This has the following definition:

def callapi(url, method='post', payload=None, headers=None, auth=None, check=True)

Using my previous trial and (mostly) error I know what is needed:

  • url

The URL of the Splunk HEC, https://<host&gt;:8088/services/collector

  • method

We want to POST the message to the Splunk HEC

  • payload

The message “hello world

  • headers

The Splunk token that is used for authentication, “x:<token>”

  • auth

The Splunk authentication token is passed as a header, so this will be NONE

  • check

This relates to SSL certificate checking, which I want to ignore initially, so this will be FALSE

To write this into the Python splunk.py file.

Adjust the import lines to include the callapi and json functions:

from loginsightwebhookdemo import app, parse, callapi
from flask import request, json

To provide some portability to the code use constants to hold the values for the Splunk HEC URL and Token:

# This is the Splunk HEC URL
SPLUNKHECURL = "https://<FQDN>:8088/services/collector/event"

# This is the token to allow authentication into Splunk HEC
# Keep this secret, as anyone with it can inject information into Splunk
SPLUNKHECTOKEN = "Splunk 1234X12X-123X-XXXX-XXXX-12XX3XXX1234"

Inside the splunk function we need to build the necessary header and body of the call to the Splunk HEC.

Add a header variable that holds the HEC authorisation token:

MESSAGEHEADER = {'Authorization': SPLUNKHECTOKEN}

Create the body of the Splunk message:

MESSAGEDATA = {
 "sourcetype": "txt",
 "event": { "hello world" },
 }

Finally add the callapi call to the return line so the function will close out this function by outputting any return value from using the callapi function:

# Post the message to Splunk and exit the script
return callapi(SPLUNKHECURL, 'post', json.dumps(MESSAGEDATA), MESSAGEHEADER, None, False)

The body of the splunk.py file now looks like:

#!/usr/bin/env python

# These are integration functions written by VMware
from loginsightwebhookdemo import app, parse, callapi
from flask import request, json

# This is the Splunk HEC URL
SPLUNKHECURL = "https://<FQDN>:8088/services/collector/event"

# This is the token to allow authentication into Splunk HEC
# Keep this secret, as anyone with it can inject information into Splunk
SPLUNKHECTOKEN = "Splunk 1234X12X-123X-XXXX-XXXX-12XX3XXX1234"

# This is the splunk integration function
@app.route("/endpoint/splunk", methods=['POST'])
@app.route("/endpoint/splunk/<ALERTID>", methods=['POST','PUT'])
def splunk(ALERTID=None):
 # Retrieve fields in notification, using pre-written VMware function
 alert = parse(request)
 
 MESSAGEHEADER = {'Authorization': SPLUNKHECTOKEN}
 MESSAGEDATA = {
 "sourcetype": "txt",
 "event": { "hello world" },
 }
 
 # Post the message to Splunk and exit the script
 return callapi(SPLUNKHECURL, 'post', json.dumps(MESSAGEDATA), MESSAGEHEADER, None, False)

Now when vROps sends the notification it will be parsed and displayed to the screen and a Hello World output will appear in the Splunk HEC.

Stage 4 – Use python to turn the vROps output into the Splunk input

Nearly there!

All the necessary code is actually done, the only section that now needs updating is the actual MESSAGEDATA and this is where the actual requirements are fulfilled.

It’s fairly simple. The parsed output is a Python dictionary which is called alert. The values within alert are referenced by their element and output the value:

value = alert['element']

How do you know what elements are included? They’re actually shown in the parsed output from the parse function:

vrops-parsed

For example:

value = alert['status']

Will give an output of ‘ACTIVE’

vrops-element-example

In this example I will pull in a few elements that are included in the parsed alert output:

MESSAGEDATA = {
 "sourcetype":alert['resourceName'],
 "event":{
   "Title": alert['AlertName'],
   "Impacted_Object": alert['resourceName'],
   "Source": alert['hookName'],
   "Status": alert['status'],
 },
}

And in a nutshell, that’s how to get vROps sending basic alerts to Splunk via a HEC.

But wait… the alert notifications doesn’t contain half the information that we need. We need to call back to vROps to get the rest of the information.

Stage 5 – Phoning home for more information

At this point, it’s going to basically be REST API calls back to vROps and this is fairly well documented at https://<VROPS FQDN>/suite-api/docs/rest/index.html

To make this work above the body of the Splunk function add some additional constants that will hold various authentication code and URLs.

# vRealize Operations Details
VROPSURL = "https://<FQDN>"
VROPSUSER = "admin"
VROPSPASSWORD = "password"
VROPSAPI = "/suite-api/api"
VROPSAPIALERT = "/suite-api/api/alerts"

Now in the body of the function, before the MESSAGEBODY variable is built, add some lines to build the URL of the alert and make a REST call back to vROps:

The vROps output needs to be in JSON format:

jsonHeader = {'accept': 'application/json'}

And build the correct URL for calling the alert:

ALERTURL = VROPSURL + VROPSAPIALERT + "/" + ALERTID

Now make a request to the URL passing the various authentication parameters and storing the output:

 alertIDResponse = requests.get(ALERTURL , headers=jsonHeader, auth=(VROPSUSER, VROPSPASSWORD), verify=False)

Check the response code and collect the alert Definition ID number:

if alertIDResponse.status_code == requests.codes.ok:
  alertDefID = alertIDResponse.json().get('alertDefinitionId')
else:
  alertDefID = "Unable to find the alert"

Now alertDefID variable holds the definition ID and from this we can make another REST call and get the alert definition information. This will include a recommendation ID number (if the alert has any recommendations). Then you can make another REST call to vROps using the Recommendation alert ID and get the recommendation information.

Put all of this together and you can send Splunk the Alert, the definition and any recommendation.
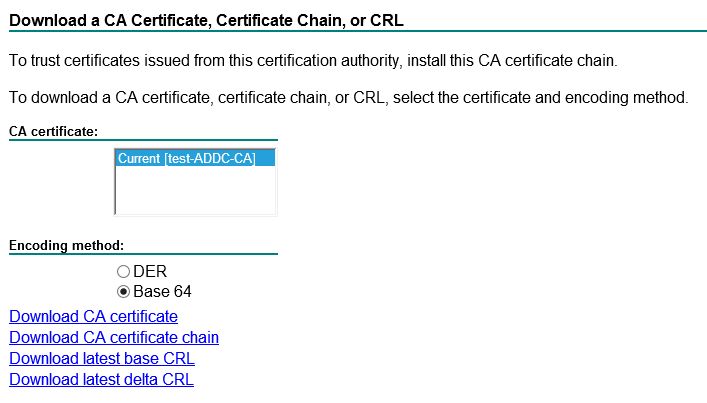
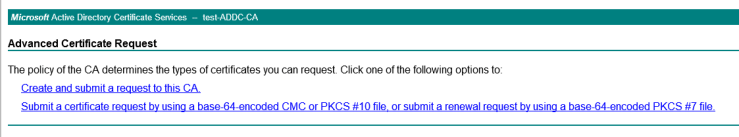