**UPDATE**
VMware have released a vRealize Operations pack, which you can read about and download from here.
It’s entirely possible that this pack features an updated version of this dashboard 😉
****
Saunter in the office, after the New Year break, ready for the challenges that 2018 will bring. The coffee is barely out of the pot when Intel drops a late crimbo present…
It’s in the mainstream media and the directors are panicking “What’s my exposure?”
Well let’s ask vRealize Operations.
So this blog post will concentrate on my VMware lab, and images are obviously edited to remove details, but the principles work.
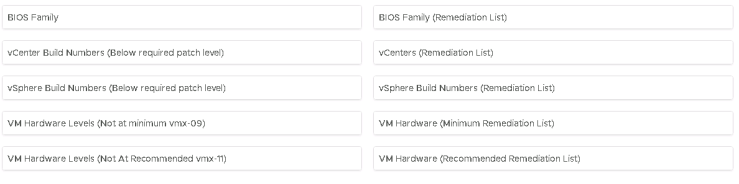
There are four areas that are immediately exposed to me via vRealize Operations that I can use to see where I’m carrying a risk:
- Physical Server BIOS
- VMware vCenter
- VMware ESXi
- VMware VM hardware level
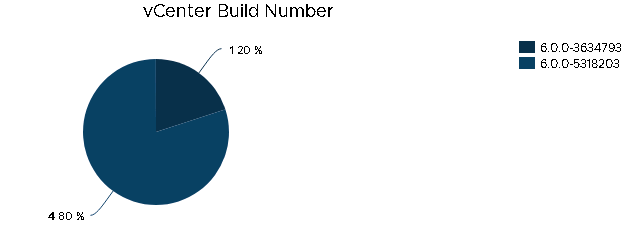
I want a pie-chart for a quick visualisation and ideally a list of objects that need patching.
Create a new dashboard:

Then I shall use the View widget (enabling information to be presented in both a pie-chart and a list) and layout my dashboard:

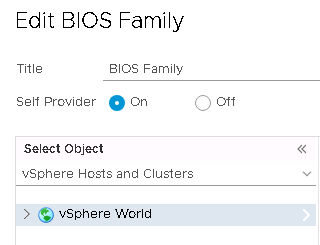
To create the first view, edit the widget providing:
- Title
- Self-Provider : On
- Object : vSphere Hosts and Clusters, vSphere World
Create a view with the following settings:
- Name = Some easily identifiable unique name
- Description = Something relevant
- Presentation = Distribution
- Visualisation = Pie Chart
- Subject = Host System
- Data = Host System, Properties
Add the following properties:
- Hardware | Hardware Model
Provide a better metric label and optionally add a filter. I’ve not because my BIOS levels are for HPE and just show the BIOS family, so not entirely useful.
Hit Save and then Save again to load the view to the widget and voila, physical host BIOS versions.
Move to the next widget to the right and lets create a similar view that shows a list of the physical hosts. Edit the widget and provide:
- A Title
- Self-Provider : On
- Object : vSphere Hosts and Clusters, vSphere World
Create a view with the following settings:
- Name = Some easily identifiable unique name
- Description = Something relevant
- Presentation = List
- Subject = Host System
- Data = Host System, Properties
Add the following properties:
- Hardware | Hardware Model
- Hardware | BIOS Version
- Runtime | Power State
Hit Save and then Save again to load the view to the widget and voila a list of the physical host models, BIOS versions and power state.

Ahh, vROps, fifty shades of blue. Horrendous.
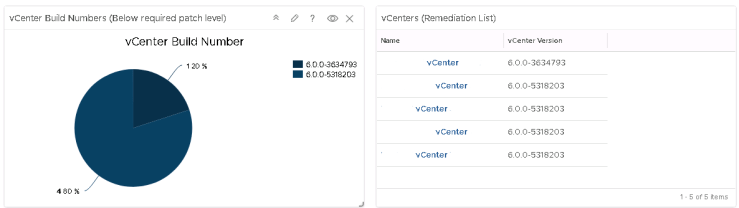
Anyway moving onwards, similar process again for vCenter Build numbers, ESXI Build numbers and VMware hardware level.
Something similar to:
Lets get a little more advanced: lets filter out my vCenters that are already patched to the appropriate level.
Lets jump over to VMware’s vCenter download page for vSphere 6.5, vSphere 6.0 and vSphere 5.5 and get the new patched build numbers.
Click on More Info to see the build number (6.5 shown)

Back in vRealize Operations, edit the first vCenter widget and edit the view.
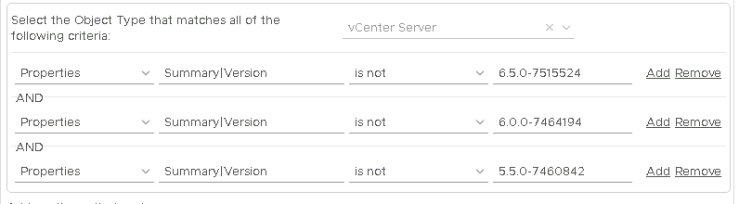
In the main Data view, switch to the Filter tab
Check the preview source to see that the Summary|Version property is the full version number, and that the final part is the build number
At the bottom of the screen add the following filter criteria:
- Properties Summary|Version is not 6.5.0-7515524
- Properties Summary|Version is not 6.0.0-7464194
- Properties Summary|Version is not 5.5.0-7460842
Save this amendment and now only the vCenters that are not at the appropriate patched levels will show.
NOTE: This will also also show vCenters that are above the filtered level
Repeat this process for the vCenter remediation list view widget:
Repeat until your sick of blue:


** Download removed, because a newer version is included in the VMware pak, outlined above.
